COVID-19 Impact on Smart Manufacturing Market by Enabling Technology (Condition Monitoring, Artificial Intelligence, IIoT, Digital Twin, Industrial 3D Printing), Information Technology (WMS, MES, PAM, HMI), Industry, and Region - Global Forecast to 2025


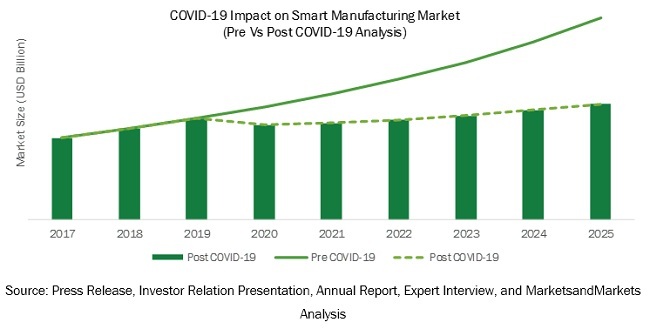
[103 Pages Report] Post COVID-19, the global smart manufacturing market size is estimated to grow from USD 181.3 billion in 2020 and projected to reach USD 220.4 billion by 2025, at a CAGR of 4.0%.
The estimation for 2020 is down by ~16% as compared to pre-COVID-19 evaluation.Factors that drive the growth of the smart manufacturing market include the increasing demand for smart manufacturing products & solution propelled by COVID-19, the importance of digital twin in maintaining operations within the manufacturing ecosystem, and the emerging & expanding role of collaborative robots in healthcare and manufacturing sectors.
Disruption in the supply chain of the manufacturing industry may adversely impact the demand for smart manufacturing products and solutions
Coronavirus has emerged from Wuhan (China), which is home to many of the factories that supply components, parts, and semi-finished products to several manufacturing units across the world. To contain the spread of the virus, Wuhan was kept under lockdown for approximately two months. During these months, manufacturing units were closed and were not able to manufacture any products. This created a ripple effect throughout the world�s manufacturing facilities and ruptured the entire supply chain. The most affected manufacturing units are:
- Those that are working on Just in Time Model, where they need the raw material exactly when they are required.
- Those that are entirely dependent on China as a source of raw materials, semi-finished goods, etc.
Because of this situation, most of the manufacturing companies around the world are currently focusing on saving their business and cash flow, rather than investing in smart manufacturing products and solutions.
The temporary shift to the manufacturing of essential medical items is expected to boost the smart manufacturing market growth
Due to the negative impact of COVD-19, some of the non-medical manufacturing companies have started manufacturing medical-related products such as masks, ventilators, and related components, sanitizer, and others. This is one such way to minimize the impact of COVID-19 by the manufacturing companies. However, this is not a long term strategy for survival, and companies have to focus on innovation to survive the pandemic.
Manufacturing execution system in the smart manufacturing market is expected to account for high market share during 2020
Manufacturing execution systems offer companies the ability to monitor real-time production and other operations of manufacturing plants. This greatly reduces the need for onsite, and shop floor employees, thereby abiding by the lockdown and social distancing mandates to fight COVID-19. During Post COVID-19, the market for MES is expected to register a larger market size in 2020 as compared to 2019; however, since manufacturing industries have taken a major hit, it will be challenging to attain the market size estimated pre-COVID-19 by 2025.
Key Market Players
Some of the leading companies in the smart manufacturing market include 3D Systems (US), CISCO (US), Emerson Electric (US), General Electric (US), Honeywell (US), IBM (Europe), Mitsubishi Corporation (Japan), Schneider (Europe), Siemens (Europe), Oracle (US), SAP (Europe), Yokogawa (Japan), and Stratasys (US).
Emerson Electric
Emerson Electric Co. manufactures and develops process controls, systems, valves, and analytical instruments. The company offers industrial, commercial, automation, and residential solutions worldwide and operates through two business segments�Automation Solutions and Commercial & Residential Solutions. The company has 220 manufacturing locations across 150 countries, primarily located in Europe and Asia. Emerson Electric provides PAM solutions under its Automation Solutions segment. It caters to industries such as petroleum, chemicals, food & beverages, pulp & paper, pharmaceuticals, and water & wastewater treatment. Recently, Emerson has developed standard assemblies to manufacture masks, gowns, and other related products for frontline health workers. These will be distributed to new customers who can start producing the items required by healthcare workers.
ABB LTD.
ABB operates mainly in areas such as robotics, power, heavy electrical equipment, and automation technology. The company has a presence in Europe, the Americas, Asia, Africa, and the Middle East and operates mainly in areas such as robotics, power, heavy electrical equipment, and automation technology. In 2018, the company sold its Power Grids business to Hitachi (Japan) to focus more on its core business, industrial automation. The Power Grids business is expected to be divested to Hitachi by 2020. ABB�s Robotics and Discrete Automation business is planning on making key software services available free of charge to customers until the end of 2020. The software that will be available free of charge includes ABB Ability� Connected Services, and RobotStudio�.
Report Scope:
|
Report Metric |
Details |
|
Years considered |
2017�2025 |
|
Base year |
2019 |
|
Forecast period |
2020�2025 |
|
Forecast units |
Value (USD) in Million/ Billion |
|
Segments covered |
Information Technology, Enabling Technology, and Industry |
|
Regions covered |
North America, APAC, Europe, and RoW |
|
Companies covered |
Emerson (US), Honeywell (US), Rockwell (US), ABB (Switzerland), Schneider (France), IBM (US), General Electric (US), Siemens (Germany), Etc. |
In this report, the global smart manufacturing market is segmented based on information technology, enabling technology, and industry.
COVID-19 Impact on Smart Manufacturing Market by Information Technology:
- Human-Machine Interface
- Enterprise Manufacturing Intelligence
- Plant Asset Management
- Manufacturing Execution System
- Industrial Communication
- Warehouse Management System
COVID-19 Impact on Smart Manufacturing Market by Enabling Technology:
- Industrial 3D printing
- Collaborative robot
- IIOT
- AI in manufacturing
- Machine condition monitoring
- Industrial machine vision
- Industrial cybersecurity
- Digital twin
- Automated guided vehicle
COVID-19 Impact on Smart Manufacturing Market by Industry
- Process Industry
- Oil & Gas
- Food & Beverages
- Pharmaceuticals
- Chemicals
- Energy & Power
- Metals & Mining
- Pulp & Paper
- Others
- Discrete Industry
- Automotive
- Aerospace & Defense
- Semiconductor & electronics
- Medical Devices
- Machine Manufacturing
- Others
Geographic Analysis
- North America
- US
- Canada
- Mexico
- Europe
- Germany
- UK
- France
- Rest of Europe
- Asia Pacific (APAC)
- China
- Japan
- India
- Rest of APAC
- Rest of the World (RoW)
Critical Questions:
- What are the impact of COVID-19 on the smart manufacturing market and its segments?
- Will suppliers continue to explore new avenues for smart manufacturing technologies?
- Who are the top five players in the smart manufacturing market?
- What would be the growth opportunities for manufacturers in various industries?
- What are the key industry trends in the smart manufacturing market?
To speak to our analyst for a discussion on the above findings, click Speak to Analyst
TABLE OF CONTENTS
1 INTRODUCTION (Page No. - 12)
1.1 COVID-19 HEALTH ASSESSMENT
1.2 COVID-19 ECONOMIC ASSESSMENT
1.2.1 COVID-19 IMPACT ON ECONOMY�SCENARIO ASSESSMENT
2 RESEARCH METHODOLOGY (Page No. - 18)
2.1 RESEARCH DATA
2.1.1 SECONDARY DATA
2.1.1.1 Key data from secondary sources
2.1.2 PRIMARY DATA
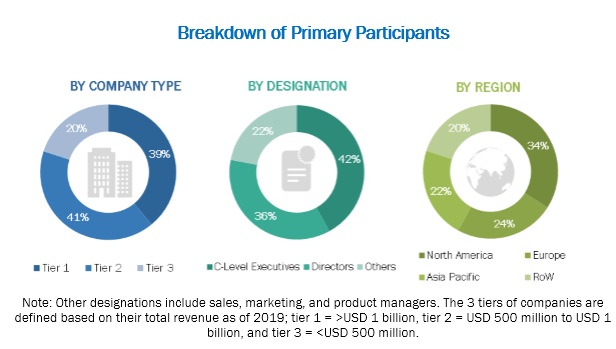
2.1.2.1 Breakdown of primary interviews
2.1.2.2 Key data from primary sources
2.2 MARKET SIZE ESTIMATION
2.2.1 BOTTOM-UP APPROACH
2.2.1.1 Approach for estimating market size by bottom-up approach (demand side)
2.2.2 TOP-DOWN APPROACH
2.2.2.1 Approach for estimating market size by top-down approach (supply side)
2.3 MARKET BREAKDOWN AND DATA TRIANGULATION
2.4 RESEARCH ASSUMPTIONS
3 EXECUTIVE SUMMARY (Page No. - 26)
3.1 PRE-COVID-19
3.2 REALISTIC SCENARIO
3.3 PESSIMISTIC SCENARIO
3.4 OPTIMISTIC SCENARIO
4 COVID-19 IMPACT ON SMART MANUFACTURING ECOSYSTEM (Page No. - 31)
4.1 INTRODUCTION
4.1.1 SMART MANUFACTURING MARKET: SHIFT IN CLIENT�S CLIENT BUSINESS ECOSYSTEM
4.2 IMPACT ON VALUE CHAIN
4.2.1 DISRUPTION IN SUPPLY CHAIN OF MANUFACTURING INDUSTRY
4.2.1.1 Supply chain disruption
4.2.1.2 Temporary shutdown of manufacturing units
4.2.1.3 Decrease in demand
4.2.2 COMPONENT MANUFACTURER ECOSYSTEM
4.2.3 SYSTEM INTEGRATOR ECOSYSTEM
4.3 STRATEGIES TO MINIMIZE IMPACT OF COVID-19
4.3.1 REAL-TIME VISIBILITY OF SUPPLY CHAIN
4.3.2 EFFECTIVE IMPLEMENTATION OF ENABLING TECHNOLOGIES
4.3.3 TEMPORARY SHIFT TO MANUFACTURING OF ESSENTIAL ITEMS
4.4 MACROECONOMIC INDICATORS, BY MAJOR COUNTRIES
4.5 MARKET DYNAMICS
4.5.1 DRIVERS
4.5.1.1 Demand for smart manufacturing solutions will be more in future than ever before
4.5.1.2 Fiscal policy steps taken by regional financial institutions to keep manufacturing facilities floating amidst COVID-19 crisis
4.5.1.3 China�s return to normalcy in the commercial trade market expected to lead positive market sentiments
4.5.1.4 Increase in use of digital twin to safely monitor smart manufacturing operations
4.5.1.5 Collaborative robots to be crucial in healthcare industry to fight pandemic and drive smart manufacturing market
4.5.2 RESTRAINTS
4.5.2.1 Lack of trained personnel to handle smart manufacturing technologies during crises such as COVID-19
4.5.3 OPPORTUNITIES
4.5.3.1 Government aid to fight against COVID-19-induced economic crisis
4.5.4 CHALLENGES
4.5.4.1 Lockdown and social distancing will save lives but may restrict commercial trade growth in coming months
4.5.4.2 Trade restrictions imposed by US on China can further prove to be deteriorating for market
5 COVID-19 IMPACT ON SMART MANUFACTURING MARKET, BY TECHNOLOGY (Page No. - 42)
5.1 INTRODUCTION
5.2 SMART MANUFACTURING MARKET, BY ENABLING TECHNOLOGY
5.2.1 COLLABORATIVE ROBOTS
5.2.2 DIGITAL TWIN
5.2.3 INDUSTRIAL 3D PRINTING
5.2.4 MACHINE CONDITION MONITORING
5.2.5 OTHERS
5.3 SMART MANUFACTURING MARKET, BY INFORMATION TECHNOLOGY
5.3.1 MANUFACTURING EXECUTION SYSTEM
5.3.2 PLANT ASSET MANAGEMENT
5.3.3 WAREHOUSE MANAGEMENT SYSTEM
5.3.4 OTHERS
6 COVID-19 IMPACT ON SMART MANUFACTURING MARKET, BY INDUSTRY (Page No. - 55)
6.1 INTRODUCTION
6.2 LEAST IMPACTED INDUSTRIES BY COVID-19
6.2.1 PHARMACEUTICALS
6.2.1.1 Impact analysis
6.2.2 MEDICAL DEVICES
6.2.2.1 Impact analysis
6.3 MOST IMPACTED INDUSTRIES BY COVID-19
6.3.1 AVIATION
6.3.1.1 Impact analysis
6.3.2 AUTOMOTIVE
6.3.2.1 Impact analysis
6.4 ESTIMATION OF SMART MANUFACTURING MARKET
6.5 PROCESS INDUSTRY
6.6 DISCRETE INDUSTRY
7 COVID-19 IMPACT ON SMART MANUFACTURING, BY GEOGRAPHY (Page No. - 65)
7.1 INTRODUCTION
7.2 NORTH AMERICA
7.2.1 US
7.2.2 CANADA
7.3 EUROPE
7.3.1 GERMANY
7.3.2 UK
7.3.3 FRANCE
7.4 APAC
7.4.1 CHINA
7.4.2 JAPAN
7.4.3 SOUTH KOREA
7.5 ROW
8 COMPANY PROFILES (Page No. - 77)
8.1 INTRODUCTION
(Business Overview and COVID-19-Related Developments)*
8.2 ABB
8.3 CISCO
8.4 EMERSON
8.5 FANUC
8.6 GE
8.7 HEWLETT PACKARD ENTERPRISE
8.8 HONEYWELL
8.9 IBM
8.10 INTEL
8.11 MICROSOFT CORPORATION
8.12 MITSUBISHI
8.13 ORACLE
8.14 PTC
8.15 ROCKWELL AUTOMATION
8.16 SAP
8.17 SCHNEIDER ELECTRIC
8.18 SIEMENS
8.19 STRATASYS
8.20 UNIVERSAL ROBOTS
8.21 YOKOGAWA
* Business Overview and COVID-19-Related Developments might not be captured in case of unlisted companies.
8.22 SHORT-TERM AND LONG-TERM STRATEGIES
8.22.1 SHORT-TERM STRATEGIES
8.22.1.1 Modify business-related strategies
8.22.1.2 Prioritize companies manufacturing essential goods
8.22.1.3 Prioritize health of employees
8.22.2 LONG-TERM STRATEGIES
8.22.2.1 Strengthening supply chain
8.22.2.2 Digitalization and migration toward industrial automation using smart manufacturing
9 APPENDIX (Page No. - 99)
9.1 DISCUSSION GUIDE
9.2 KNOWLEDGE STORE: MARKETSANDMARKETS� SUBSCRIPTION PORTAL
9.3 AVAILABLE CUSTOMIZATIONS
9.4 RELATED REPORTS
9.5 AUTHOR DETAILS
LIST OF TABLES (23 TABLES)
TABLE 1 WORLD GDP GROWTH PROJECTION FOR 2020 AND 2021 (YEAR-ON-YEAR % CHANGE)
TABLE 2 PRE- AND POST-COVID-19 ANALYSIS FOR SMART MANUFACTURING MARKET, BY ENABLING TECHNOLOGY, 2017�2025 (USD BILLION)
TABLE 3 PRE- AND POST-COVID-19 ANALYSIS FOR SMART MANUFACTURING MARKET, BY COLLABORATIVE ROBOT, 2017�2025 (USD BILLION)
TABLE 4 PRE- AND POST-COVID-19 ANALYSIS FOR SMART MANUFACTURING MARKET, BY DIGITAL TWIN, 2017�2025 (USD BILLION)
TABLE 5 PRE- AND POST-COVID-19 ANALYSIS FOR SMART MANUFACTURING MARKET, BY INDUSTRIAL 3D PRINTING, 2017�2025 (USD BILLION)
TABLE 6 PRE- AND POST-COVID-19 ANALYSIS FOR SMART MANUFACTURING MARKET, BY MACHINE CONDITION MONITORING, 2017�2025 (USD BILLION)
TABLE 7 PRE- AND POST-COVID-19 ANALYSIS FOR SMART MANUFACTURING MARKET, BY OTHER ENABLING TECHNOLOGY, 2017�2025 (USD BILLION)
TABLE 8 PRE- AND POST-COVID-19 ANALYSIS FOR SMART MANUFACTURING MARKET, BY INFORMATION TECHNOLOGY, 2017�2025 (USD BILLION)
TABLE 9 PRE- AND POST-COVID-19 ANALYSIS OF SMART MANUFACTURING MARKET, BY MANUFACTURING EXECUTION SYSTEM, 2017�2025 (USD BILLION)
TABLE 10 PRE- AND POST-COVID-19 ANALYSIS OF SMART MANUFACTURING MARKET, BY PLANT ASSET MANAGEMENT, 2017�2025 (USD BILLION)
TABLE 11 PRE- AND POST-COVID-19 ANALYSIS OF SMART MANUFACTURING MARKET, BY WAREHOUSE MANAGEMENT SYSTEM, 2017�2025 (USD BILLION)
TABLE 12 PRE- AND POST-COVID-19 ANALYSIS OF SMART MANUFACTURING MARKET, BY OTHER INFORMATION TECHNOLOGY, 2017�2025 (USD BILLION)
TABLE 13 STEPS TAKEN BY PHARMACEUTICALS INDUSTRY TO REDUCE IMPACT OF COVID-19
TABLE 14 STEPS TAKEN BY MEDICAL DEVICES INDUSTRY TO DE-RISK IMPACT OF COVID-19
TABLE 15 STEPS TAKEN BY AVIATION INDUSTRY TO DE-RISK IMPACT OF COVID-19
TABLE 16 STEPS TAKEN BY AUTOMOTIVE INDUSTRY TO DE-RISK IMPACT OF COVID-19
TABLE 17 SMART MANUFACTURING MARKET, BY PROCESS INDUSTRY, 2017�2025, (USD BILLION)
TABLE 18 SMART MANUFACTURING MARKET, BY DISCRETE INDUSTRY, 2017�2025, (USD BILLION)
TABLE 19 SMART MANUFACTURING MARKET, BY REGION, 2017�2025 (USD BILLION)
TABLE 20 PRE- AND POST-COVID-19 ANALYSIS FOR SMART MANUFACTURING MARKET IN NORTH AMERICA, 2017�2025 (USD BILLION)
TABLE 21 PRE- AND POST-COVID-19 ANALYSIS FOR SMART MANUFACTURING MARKET IN EUROPE, 2017�2025 (USD BILLION)
TABLE 22 PRE- AND POST-COVID-19 ANALYSIS FOR SMART MANUFACTURING MARKET IN APAC, 2017�2025 (USD BILLION)
TABLE 23 PRE- AND POST-COVID-19 ANALYSIS FOR SMART MANUFACTURING MARKET IN ROW, 2017�2025 (USD BILLION)
LIST OF FIGURES (35 FIGURES)
FIGURE 1 COVID-19 GLOBAL PROPAGATION
FIGURE 2 COVID-19 PROPAGATION: SELECT COUNTRIES
FIGURE 3 COUNTRIES BEGIN WITH SIMILAR TRAJECTORIES, BUT CURVES DEVIATE BASED ON MEASURES TAKEN
FIGURE 4 REVISED GDP FORECASTS FOR SELECT G20 COUNTRIES IN 2020
FIGURE 5 CRITERIA IMPACTING GLOBAL ECONOMY
FIGURE 6 SCENARIOS IN TERMS OF RECOVERY OF GLOBAL ECONOMY
FIGURE 7 MARKET SIZE ESTIMATION METHODOLOGY: BOTTOM-UP APPROACH
FIGURE 8 MARKET SIZE ESTIMATION METHODOLOGY: TOP-DOWN APPROACH
FIGURE 9 DATA TRIANGULATION
FIGURE 10 ASSUMPTIONS FOR THE RESEARCH STUDY
FIGURE 11 PRE- AND POST-COVID-19 IMPACT ANALYSIS ON SMART MANUFACTURING MARKET
FIGURE 12 IMPACT OF COVID-19 ON ENABLING AND INFORMATION TECHNOLOGIES
FIGURE 13 IMPACT OF COVID-19 ON PROCESS AND DISCRETE INDUSTRIES
FIGURE 14 IMPACT OF COVID-19 ON SMART MANUFACTURING, BY REGION
FIGURE 15 SMART MANUFACTURING MARKET ECOSYSTEM
FIGURE 16 SHIFT IN CLIENT�S CLIENT REVENUE
FIGURE 17 DISRUPTION IN MANUFACTURING ECOSYSTEM
FIGURE 18 CARES ACT PACKAGE BREAKUP
FIGURE 19 IMPACT OF COVID-19 ON SMART MANUFACTURING MARKET FOR ENABLING TECHNOLOGIES
FIGURE 20 IMPACT OF COVID-19 ON SMART MANUFACTURING MARKET FOR COLLABORATIVE ROBOTS
FIGURE 21 IMPACT OF COVID-19 ON SMART MANUFACTURING MARKET FOR DIGITAL TWIN
FIGURE 22 IMPACT OF COVID-19 ON SMART MANUFACTURING MARKET FOR INDUSTRIAL 3D PRINTING
FIGURE 23 IMPACT OF COVID-19 ON SMART MANUFACTURING MARKET FOR MACHINE CONDITION MONITORING
FIGURE 24 IMPACT OF COVID-19 ON SMART MANUFACTURING MARKET FOR OTHER ENABLING TECHNOLOGIES
FIGURE 25 IMPACT OF COVID-19 ON SMART MANUFACTURING MARKET FOR INFORMATION TECHNOLOGIES
FIGURE 26 IMPACT OF COVID-19 ON SMART MANUFACTURING MARKET FOR MANUFACTURING EXECUTION SYSTEM
FIGURE 27 IMPACT OF COVID-19 ON SMART MANUFACTURING MARKET FOR PLANT ASSET MANAGEMENT
FIGURE 28 IMPACT OF COVID-19 ON SMART MANUFACTURING MARKET FOR WAREHOUSE MANAGEMENT SYSTEM
FIGURE 29 IMPACT OF COVID-19 ON SMART MANUFACTURING MARKET FOR OTHER INFORMATION TECHNOLOGIES
FIGURE 30 SMART MANUFACTURING MARKET FOR PROCESS INDUSTRY, 2019�2020
FIGURE 31 DECLINE IN SIZE OF SMART MANUFACTURING MARKET FOR AEROSPACE & DEFENSE AND AUTOMOTIVE
FIGURE 32 IMPACT OF COVID-19 ON SMART MANUFACTURING MARKET IN NORTH AMERICA
FIGURE 33 IMPACT OF COVID-19 ON SMART MANUFACTURING MARKET IN EUROPE
FIGURE 34 IMPACT OF COVID-19 ON SMART MANUFACTURING MARKET IN APAC
FIGURE 35 IMPACT OF COVID-19 ON SMART MANUFACTURING MARKET IN ROW
The study involved four major activities for estimating the size of the smart manufacturing market. Exhaustive secondary research has been conducted to collect information on the market, the peer markets, the parent market, and the impact of COVID-19. The next step involved has been validating these findings, assumptions, and sizing, with industry experts across the value chain through primary research. Both top-down and bottom-up approaches have been employed to estimate the overall market size. After that, market breakdown and data triangulation techniques have been used to estimate the market size of segments and subsegments.
Secondary Research
In the secondary research process, various secondary sources have been referred to for identifying and collecting information important for this study. Secondary sources such as government sources; corporate filings (such as annual reports, investor presentations, and financial statements); and trade, business, and professional associations have been used to identify and collect information for an extensive technical and commercial study of the smart manufacturing market.
Primary Research
In the primary research process, primary sources from both supply and demand sides have been interviewed to obtain qualitative and quantitative information important for this report. Primary sources, such as experts from related industries and suppliers, have been interviewed to obtain and verify critical information, especially with respect to the impact of COVID-19. Key players in the smart manufacturing market have been identified through secondary research, and their respective market rankings have been determined through primary and secondary research. This research included studying annual reports of top market players and interviewing key opinion leaders such as CEOs, directors, and marketing personnel.
To know about the assumptions considered for the study, download the pdf brochure
Market Size Estimation
In the complete market engineering process, both top-down and bottom-up approaches have been implemented, along with several data triangulation methods, to estimate and validate the size of the smart manufacturing market post-COVID-19 and other dependent submarkets listed on this report.
- Key players in the industry and markets have been identified through extensive secondary research.
- The industry�s supply chain and market size, in terms of value, have been determined through primary and secondary research.
All percentage shares, splits, breakdowns, and COVID-19 impact estimation have been determined using secondary sources and verified through primary sources.
Data Triangulation
After arriving at the overall market size, the total smart manufacturing market has been split into several segments. To complete the overall market engineering process and arrive at exact statistics for all segments, market breakdown, and data triangulation procedures have been employed, wherever applicable. The data has been triangulated by studying various factors and trends from both the demand and supply sides. The market has also been validated using both top-down and bottom-up approaches.
Study Objectives:
- To describe and forecast the smart manufacturing market, in terms of technology, by information technology and enabling technology.
- To describe and forecast the market, in terms of value, by region�North America, Europe, Asia Pacific (APAC), and the Rest of the World (RoW)
- To assess the impact of COVID-19 on each of the above segments and regions
- To provide detailed information regarding factors (drivers, restraints, opportunities, and challenges) influencing the smart manufacturing market growth
- To provide a comprehensive overview of the value chain of the smart manufacturing ecosystem
- To analyze opportunities for stakeholders in the smart manufacturing market by identifying its high-growth segments
Available Customizations:
With the given market data, MarketsandMarkets offers customizations according to a company�s specific needs. The following customization options are available for the smart manufacturing market report.
Company information:
- Detailed analysis and profiling of additional market players (up to 5)


Growth opportunities and latent adjacency in COVID-19 Impact on Smart Manufacturing Market