Electric Vehicle Charging Stations Market by Charging Station (AC Charging Station, DC Charging Station), Installation Type (Residential, Commercial), and Region (North America, Europe, Asia Pacific, and Row) - Global Forecast to 2023


MarketsandMarkets forecasts the electric vehicle charging stations (EVCS) market is expected to grow from USD 3.22 billion in 2017 to reach USD 30.41 billion by 2023, at a CAGR of 41.8% between 2018 and 2023. The key factors driving the growth of the market include government funding, subsidies, and incentives, growing demand of electric vehicles, growing concern toward environmental pollution, and heavy investment from automakers in EVs. However, high price and small distance covered by EVs and lack of standardization with EV charging are the key restraining factors for market growth.
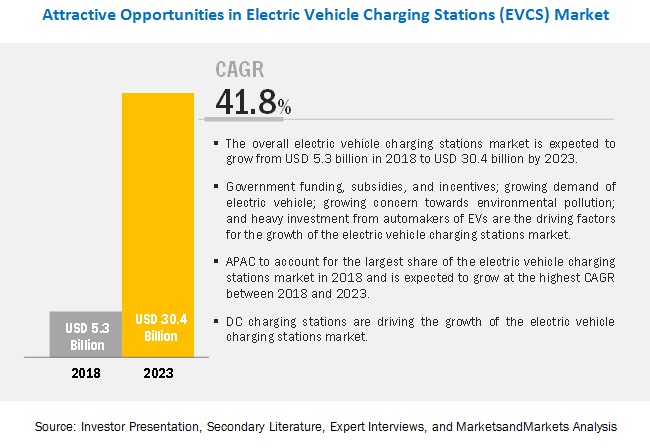
DC charging station to hold largest share of electric vehicle charging stations market between 2018 and 2023
The ability of DC charging stations to charge an EV in lesser time compared to AC charging stations is the primary driving factor for the high growth rate of former in the electric vehicle charging stations market. Also, the increasing popularity of public charging stations is boosting the demand for DC charging stations. Furthermore, automakers are planning to invest in DC fast charging network to support their launch of long-range BEVs.
Commercial installation to hold largest share of electric vehicle charging stations market between 2018 and 2023
The growth is attributed to an increased deployment of charging stations at public places such as shopping malls, commercial buildings, airports, and restaurants. The convenience of being able to use an EV charger while shopping or during office hours is expected to boost the adoption of electric vehicles. Furthermore, government offerings, such as tax credits, on the installation of publicly accessible stations are expected to boost the commercial installation of charging stations.
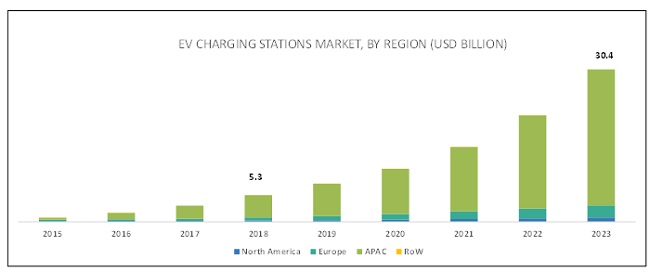
APAC to hold the largest share of electric vehicle charging stations market during forecast period
A majority of electric vehicle charging station installations in APAC is driven by huge demand in countries such as China and Japan. Currently, APAC is the largest market for electric vehicle charging stations globally. Furthermore, South Korea and India are taking initiatives to reduce greenhouse gas emissions by increasing the use of EVs. For instance, India, one of the largest contributors of greenhouse gases, has pledged to phase out petrol and diesel cars by 2030. This initiative by the Indian government is expected to create a huge demand for EVs and EV charging infrastructure in the country. Moreover, in September 2017, the Indian government decided to buy 10,000 electric cars from Tata Motors to replace old petrol and diesel cars used by government agencies. Furthermore, in September 2017, the Singapore government launched its first large-scale EV car sharing program. Under the car sharing program, BlueSG (Singapore), a subsidiary of Bollore Group, will install 500 charging stations equipped with 2,000 charging points in Singapore.
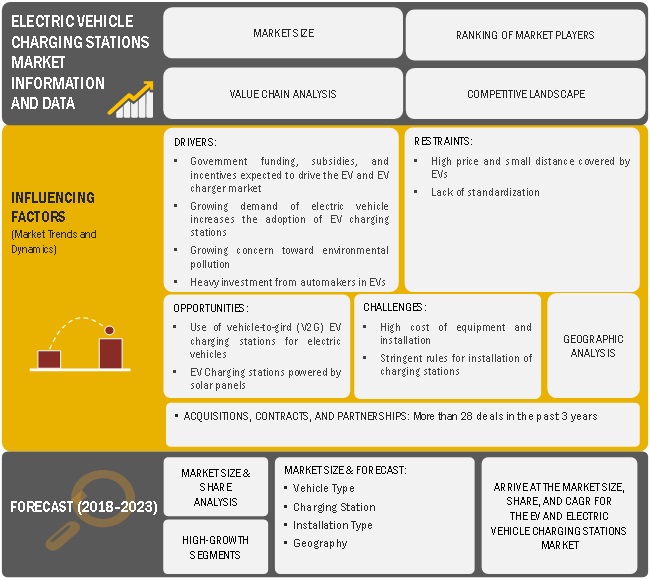
Market Dynamics
Driver: Government funding, subsidies, and incentives to drive the EV charging stations market
The growing need for EVs in various parts of the world is expected to increase the demand for charging stations. As a result, various governments are funding for the development of charging station infrastructure, as well as subsidizing the EV charging infrastructure. For instance, in July 2016, the US Government announced to form a partnership between the Department of Transportation (DOT) and the Department of Energy (DOE) for �a 2020 vision for a national fast charging network.� The project is a part of Fixing America�s Surface Transportation (FAST) Act. The partnership will determine the best locations for charging stations and the cost for charging and utility infrastructure. Furthermore, in September 2017, the German Federal Ministry of Transport and Digital Infrastructure granted a fund of USD 4.9 million to Fastned B.V., an EV fast-charging station provider. This fund was given to develop 25 fast-charging stations in Germany, which are capable to provide a distance up to 250 km within 20 minutes.
Restraint: High price and small distance covered by EVs
An electric vehicle costs more than a conventional vehicle. For instance, FIAT 500X (petrol version) and FIAT 500e (electric version) cost USD 19,995 and USD 32,780, respectively. Moreover, BMW, Audi, Mercedes-Benz, Cadillac, and Tesla cost between USD 43,000 and USD 100,000, which are more expensive than normal cars. The high pricing of EV is constraining the adoption of vehicles.
In addition, many vehicle owners are concerned about the range or distance covered in a single drive of EVs. The coverage of EVs is shorter than that of fuel-based cars. Many EVs cover a distance between 11 miles and 21 miles, because of the low-energy density of batteries. The maximum coverage of an EV is 315 miles (Tesla Model S). Users usually prefer covering a long distance without any interruption, especially for long trips, and a long-range EV comes at a high price. This factor could inhibit the growth of the electric vehicle charging stations market.
Opportunity: Use of vehicle-to-grid (V2G) EV charging stations for electric vehicles
Vehicle-to-grid (V2G) EV charging describes a system in which there is a bi-directional electrical energy flow between plug-in EVs and the power grid. V2G technology facilitates EVs to store unused power and discharge it to the grid. V2G technology can improve the electrical component�s performance and create value for EV owners.
In May 2017, Enel Energia S.p.a installed 2 vehicle-to-grid (V2G) electric car charging stations at the Genoa headquarters of the Italian Institute of Technology. The installation is part of MOV-E, a corporate electric car sharing pilot project in collaboration with Nissan. Nissan has provided 2 battery EVs (LEAF model) to the Italian Institute of Technology, as well as provided an app management platform known as Glide. The agreement between Enel and Nissan signifies a change in the world of technology in terms of sustainable mobility. Thus, V2G charging technology is a key opportunity for manufactures as it will transform the world of EVs and shape the future of EV charging.
Challenge: Stringent rules for installation of charging stations
A service provider must follow a certain set of instructions when installing a charging station. They need approval from plot owners when the installation is on a private property, local governments in terms of regulatory mandates, and utility providers for energy transfer. For instance, homeowners or contractors need to submit plot plan, electrical load calculations, electrical plans, installation instructions, and charger specifications to the local permitting office for obtaining a permit for a typical installation of residential EV charging station. The installation of EV charging stations is more complex in commercial locations than in residential locations. The commercial installation requires permits, community or design guidelines, electrical source or metering, parking and signage requirements, zoning requirements, and inspection fees. Thus, the installation of charging station is complex as many stages are involved in the value chain.
Scope of Report:
|
Report Metric |
Details |
|
Years considered for providing market size |
2015�2023 |
|
Base year considered |
2017 |
|
Forecast period |
2018�2023 |
|
Forecast units |
Value (USD) in million/billion |
|
Segments covered |
Vehicle Type, Charging Station, Installation Type |
|
Regions covered |
North America, APAC, Europe, and RoW |
|
Companies covered |
ABB (Switzerland), AeroVironment (US), ChargePoint (US), Engie (France), Tesla (US), Schneider Electric (France), Siemens (Germany), Efacec (Portugal), EVgo (US), Leviton (US), Alfen (Netherlands), Allego (Netherlands), Blink Charging (US), Clipper Creek (US), SemaConnect (US), and TGOOD (Hong Kong) |
This research report categorizes the global electric vehicle market on the basis of vehicle type and region; and the electric vehicle charging stations market on the basis of charging station, installation type, and region.
Electric Vehicle Market, by Vehicle Type
- Battery Electric Vehicle (BEV)
- Plug-in Hybrid Electric Vehicle (PHEV)
Electric Vehicle Charging Stations Market, by Charging Station
- AC Charging Station
- Level 1 AC
- Level 2 AC
- DC Charging Station
- Inductive Charging Station
Electric Vehicle Charging Stations Market, by Installation Type
- Residential
- Commercial
Electric Vehicle and Electric Vehicle Charging Stations Market, by Region
- North America
- Europe
- Asia Pacific (APAC)
- Rest of the World (RoW)
Key Market Players
As of 2017, ABB (Switzerland), AeroVironment (US), ChargePoint (US), Engie (France), and Tesla (US) were the major players in the electric vehicle charging stations market.
ChargePoint is one of the leading players in the electric vehicle charging stations market. The company maintains and operates world�s largest open EV charging network. Moreover, ChargePoint is one of the few EV charging companies, which designs and develops its own EV charging hardware and software. To further strengthen its leadership position, the company adopts strategies such as strategic partnerships and acquisitions to expand its charging network globally. In the recent past, ChargePoint has established partnerships with local EV charging network providers to expand its network in Europe. For instance, in November 2017, ChargePoint partnered with Technical Services Group (TSG) to install EV charging stations in Europe.
Tesla is engaged in designing and developing electric cars and DC fast charging stations for its customers. Tesla is recognized to revolutionize the electro mobility ecosystem by manufacturing all electric production cars. The company�s cutting edge battery technology and electric powertrain coupled with a rapidly growing fast charging network has contributed in becoming one of the leading players in the electric vehicle charging stations market. Tesla�s ambitious plan of increasing the production rate of its EV and expanding its supercharger network globally is going to strengthen its leadership position in the electric vehicle charging stations market. The company mainly focuses on forming strategic partnerships with other companies to expand its EV charging infrastructure. For instance, in July 2016, Tesla entered into a partnership with Ruby Tuesday (US), a leading multinational foodservice retailer. Ruby Tuesday will be opening a series of supercharger stations in the premises of its restaurants spread across the world starting from one of its restaurant in Missouri, US.
Key Developments
- In January 2018, AeroVironment launched TurboDX, the company�s next-generation EV charging station at the CES Digital Experience held in Las Vegas, US. The highly durable TurboDX is compatible with the company�s TurboCord charging system, giving customers the option of choosing from a variety of Open Charge Point Protocol (OCPP)-compliant charging network. The new charging station also features smart charging, which is capable of meeting the different energy needs of residential, commercial, and utility charging.
- In January 2018, ABB signed a contract with Nanyang Technological University (Singapore). ABB will be providing its state-of-the-art heavy vehicle chargers�300P�to the upcoming autonomous electric bus project in Singapore. The 300kW DC fast charging station will be used to charge 2 Volvo 7900 electric buses, which are used in the project.
- In December 2017, EVgo partnered with Nissan North America (US) to expand its fast charging network across US. The company installed its 1,000th DC fast charging station in Washington, DC.
Key Questions Answered:
- Which type of charging station is expected to have the highest demand in the future?
- Which is the most dominated installation type of EV charging stations in the market?
- Which are the key geographies for EV charging stations in the market?
- What are the key trends in the EV charging stations market?
To speak to our analyst for a discussion on the above findings, click Speak to Analyst
Table of Contents
1 Introduction
1.1 Objectives of the Study
1.2 Definition
1.3 Scope of the Study
1.3.1 Market Covered
1.3.2 Years Considered for the Study
1.4 Currency & Pricing
1.5 Limitations
1.6 Stakeholders
2 Research Methodology
2.1 Research Data
2.1.1 Secondary Data
2.1.1.1 List of Major Secondary Sources
2.1.1.2 Secondary Sources
2.1.2 Primary Data
2.1.2.1 Primary Interviews With Experts
2.1.2.2 Primary Sources
2.1.3 Secondary & Primary Research
2.1.3.1 Key Industry Insights
2.1.3.2 Breakdown of Primaries
2.2 Market Size Estimation
2.2.1 Bottom-Up Approach
2.2.1.1 Approach for Arriving at Market Share By Bottom-Up Analysis (Demand Side)
2.2.2 Top-Down Approach
2.2.2.1 Approach for Capturing Market Share By Top-Down Analysis (Supply Side)
2.3 Market Breakdown & Data Triangulation
2.4 Research Assumptions
3 Executive Summary
4 Premium Insights
4.1 Electric Vehicle Market, By Vehicle Type
4.2 Electric Vehicle Charging Stations Market, 2020�2025 (USD Million)
4.3 Electric Vehicle Charging Stations Market, By Charging Station
4.4 Electric Vehicle Charging Stations Market, By Installation Type
4.5 Electric Vehicle Charging Stations Market, By Geography
5 Market Overview
5.1 Introduction
5.2 Market Dynamics
5.2.1 Drivers
5.2.1.1 Government Funding, Subsidies, and Incentives Expected to Drive the EV and EV Charging Stations Market
5.2.1.2 Growing Demand for Electric Vehicles Increases the Adoption of EV Charging Stations
5.2.1.3 Growing Concern Toward Environmental Pollution
5.2.1.4 Heavy Investment From Automakers in EVS
5.2.2 Restraints
5.2.2.1 High Price and Small Distance Covered By EVS
5.2.2.2 Lack of Standardization
5.2.3 Opportunities
5.2.3.1 Use of Vehicle-To-Grid (V2G) EV Charging Stations for Electric Vehicles
5.2.3.2 EV Charging Stations Powered By Solar Panels
5.2.4 Challenges
5.2.4.1 High Cost of Equipment and Installation
5.2.4.2 Stringent Rules for Installation of Charging Stations
6 Industry Tends
6.1 Introduction
6.2 Value Chain Analysis
6.3 Batteries Used in Electric Vehicles
6.3.1 Lead�Acid Battery
6.3.1.1 Advantages of Lead�Acid Battery
6.3.1.2 Disadvantages of Lead�Acid Battery
6.3.2 Nickel�Metal Hydride Battery
6.3.2.1 Advantages of Ni-Mh Battery
6.3.2.2 Disadvantages of Ni-Mh Battery
6.3.3 Lithium�Ion Battery
6.3.3.1 Advantages of Lithium�Ion Battery
6.3.3.2 Disadvantages of Lithium�Ion Battery
6.3.4 Solid-State Battery
7 EV Market Analysis, By Vehicle Type
7.1 Introduction
7.2 Battery Electric Vehicle (BEV)
7.3 Plug�In Hybrid Vehicle (PHEV)
7.3.1 Series PHEV
7.3.2 Parallel PHEV
8 EVCS Market Analysis, By Charging Station
8.1 Introduction
8.2 AC Charging Station
8.2.1 Level 1 Charging Station
8.2.2 Level 2 Charging Station
8.3 DC Charging Station
8.4 Inductive Charging Station�An Upcoming Technology
9 Standards of Electric Vehicle Charging Stations
9.1 Introduction
9.2 SAE J1772
9.3 Chademo
9.4 Tesla Supercharger
9.5 GB/T
9.6 CCS
9.7 IEC 62196
10 EVCS Market Analysis, By Installation Type
10.1 Introduction
10.2 Residential
10.3 Commercial
11 EVCS Market Analysis, By Geography
11.1 Introduction
11.2 North America
11.2.1 Us
11.2.2 Canada
11.2.3 Mexico
11.3 Europe
11.3.1 Norway
11.3.2 Germany
11.3.3 Uk
11.3.4 France
11.3.5 Netherlands
11.3.6 Rest of Europe
11.4 APAC
11.4.1 China
11.4.2 Japan
11.4.3 Rest of APAC
11.5 RoW
11.5.1 Middle East
11.5.2 Africa
12 Competitive Landscape
12.1 Overview
12.2 Market Ranking Analysis of EV Charging Station Manufacturers
12.3 Competitive Situations & Trends
12.3.1 Contracts & Acquisitions
12.3.2 Collaborations & Partnerships
12.3.3 Product Launches
12.3.4 Expansions
13 Company Profiles
13.1 Introduction
(Business Overview, Products Offered, Recent Developments, SWOT Analysis & MnM View)*
13.2 Key Players
13.2.1 Abb
13.2.2 Aerovironment
13.2.3 Chargepoint
13.2.4 Engie
13.2.5 Tesla
13.2.6 Schneider Electric
13.2.7 Siemens
13.2.8 Efacec
13.2.9 Evgo
13.2.10 Leviton
*Details on Business Overview, Products Offered, Recent Developments, SWOT Analysis & MnM View Might Not Be Captured in Case of Unlisted Companies.
13.3 Key Innovators
13.3.1 Alfen
13.3.2 Allego
13.3.3 Blink Charging
13.3.4 Clipper Creek
13.3.5 SemaConnect
13.3.6 TGOOD
14 Appendix
14.1 Insights of Industry Experts
14.2 Discussion Guide
14.3 Knowledge Store: Marketsandmarkets� Subscription Portal
14.4 Introducing RT: Real-Time Market Intelligence
14.5 Available Customizations
14.6 Related Reports
14.7 Author Details
List of Tables (102 Tables)
Table 1 Government Incentive Programs, 2019
Table 2 EV Market, in Terms of Value and Volume, 2017�2025(USD Billion and Thousand Units)
Table 3 EV Market, By Vehicle Type, 2017�2025(USD Billion)
Table 4 EV Market, By Vehicle Type, 2017�2025(Thousand Units)
Table 5 BEV Market, By Region, 2017�2025(USD Billion)
Table 6 PHEV Market, By Region, 2017�2025(USD Billion)
Table 7 EVCS Market, in Terms of Value and Volume, 2017�2025(USD Billion and Thousand Units)
Table 8 EVCS Market, By Charging Station, 2017�2025(USD Billion)
Table 9 EVCS Market, By Charging Station, 2017�2025(Thousand Units)
Table 10 EVCS Services Market, By Charging Station, 2017�2025(USD Billion)
Table 11 AC Charging Stations Market, By Type, 2017�2025(USD Billion)
Table 12 AC Charging Stations Market, By Type, 2017�2025(Thousand Units)
Table 13 AC Charging Stations Market, By Installation Type, 2017�2025(USD Million)
Table 14 AC Charging Stations Market, By Installation Type, 2017�2025(Thousand Units)
Table 15 AC Charging Stations Market, By Region, 2017�2025(USD Million)
Table 16 AC Charging Stations Market, By Region, 2017�2025(Thousand Units)
Table 17 Level 1 Charging Stations Market, By Installation Type, 2017�2025(USD Million)
Table 18 Level 1 Charging Stations Market, By Installation Type, 2017�2025(Thousand Units)
Table 19 Level 1 Charging Stations Market, By Region, 2017�2025(USD Million)
Table 20 Level 1 Charging Stations Market, By Region, 2017�2025(Thousand Units)
Table 21 Level 1 Charging Stations Market in Residential Application, By North American Countries, 2017�2025(USD Million)
Table 22 Level 1 Charging Stations Market in Residential Application, By North American Countries, 2017�2025(Thousand Units)
Table 23 Level 1 Charging Stations Market in Residential Application, By European Countries, 2017�2025(USD Million)
Table 24 Level 1 Charging Stations Market in Residential Application, By European Countries, 2017�2025(Thousand Units)
Table 25 Level 1 Charging Stations Market in Residential Application, By APAC Countries, 2017�2025(USD Million)
Table 26 Level 1 Charging Stations Market in Residential Application, By APAC Countries, 2017�2025(Thousand Units)
Table 27 Level 1 Charging Stations Market in Residential Application, By RoW, 2017�2025(USD Million)
Table 28 Level 1 Charging Stations Market in Residential Application, By RoW, 2017�2025(Thousand Units)
Table 29 Level 2 Charging Stations Market, By Installation Type, 2017�2025(USD Million)
Table 30 Level 2 Charging Stations Market, By Installation Type, 2017�2025(Thousand Units)
Table 31 Level 2 Charging Stations Market, By Region, 2017�2025(USD Million)
Table 32 Level 2 Charging Stations Market, By Region, 2017�2025(Thousand Units)
Table 33 Level 2 Charging Stations Market in Residential Application, By North American Countries, 2017�2025(USD Million)
Table 34 Level 2 Charging Stations Market in Residential Application, By North American Countries, 2017�2025(Thousand Units)
Table 35 Level 2 Charging Stations Market in Residential Application, By European Countries, 2017�2025(USD Million)
Table 36 Level 2 Charging Stations Market in Residential Application, By European Countries, 2017�2025(Thousand Units)
Table 37 Level 2 Charging Stations Market in Residential Application, By APAC Countries, 2017�2025(USD Million)
Table 38 Level 2 Charging Stations Market in Residential Application, By APAC Countries, 2017�2025(Thousand Units)
Table 39 Level 2 Charging Stations Market in Residential Application, By RoW, 2017�2025(USD Million)
Table 40 Level 2 Charging Stations Market in Residential Application, By RoW, 2017�2025(Thousand Units)
Table 41 Level 2 Charging Stations Market in Residential Application, By Region, 2017�2025(USD Million)
Table 42 Level 2 Charging Stations Market in Residential Application, By Region, 2017�2025(Thousand Units)
Table 43 Level 2 Charging Stations Market in Commercial Application, By North American Countries, 2017�2025(USD Million)
Table 44 Level 2 Charging Stations Market in Commercial Application, By North American Countries, 2017�2025(Thousand Units)
Table 45 Level 2 Charging Stations Market in Commercial Application, By European Countries, 2017�2025(USD Million)
Table 46 Level 2 Charging Stations Market in Commercial Application, By European Countries, 2017�2025(Thousand Units)
Table 47 Level 2 Charging Stations Market in Commercial Application, By APAC Countries, 2017�2025(USD Million)
Table 48 Level 2 Charging Stations Market in Commercial Application, By APAC Countries, 2017�2025(Thousand Units)
Table 49 Level 2 Charging Stations Market in Commercial Application, By RoW, 2017�2025(USD Million)
Table 50 Level 2 Charging Stations Market in Commercial Application, By RoW, 2017�2025(Thousand Units)
Table 51 Level 2 Charging Stations Market in Commercial Application, By Region, 2017�2025(USD Million)
Table 52 Level 2 Charging Stations Market in Commercial Application, By Region, 2017�2025(Thousand Units)
Table 53 DC Charging Stations Market, By Installation Type, 2017�2025(USD Million)
Table 54 DC Charging Stations Market, By Installation Type, 2017�2025(Thousand Units)
Table 55 DC Charging Stations Market, By Region, 2017�2025(USD Million)
Table 56 DC Charging Stations Market, By Region, 2017�2025(Thousand Units)
Table 57 DC Charging Stations Market in Commercial Application, By North American Countries, 2017�2025(USD Million)
Table 58 DC Charging Stations Market in Commercial Application, By North American Countries, 2017�2025(Thousand Units)
Table 59 DC Charging Stations Market in Commercial Application, By European Countries, 2017�2025(USD Million)
Table 60 DC Charging Stations Market in Commercial Application, By European Countries, 2017�2025(Thousand Units)
Table 61 DC Charging Stations Market in Commercial Application, By APAC Countries, 2017�2025(USD Million)
Table 62 DC Charging Stations Market in Commercial Application, By APAC Countries, 2017�2025(Thousand Units)
Table 63 DC Charging Stations Market in Commercial Application, By RoW, 2017�2025(USD Million)
Table 64 DC Charging Stations Market in Commercial Application, By RoW, 2017�2025(Thousand Units)
Table 65 Inductive Charging Stations Market, in Terms of Value and Volume, 2017�2025(USD Million and Units)
Table 66 EVCS Market, By Installation Type, 2017�2025(USD Billion)
Table 67 EVCS Market, By Installation Type, 2017�2025(Thousand Units)
Table 68 EVCS Market for Residential Installation, By Charging Station, 2017�2025(USD Billion)
Table 69 EVCS Market for Residential Installation, By Region, 2017�2025(USD Million)
Table 70 EVCS Market for Residential Installation, By Region, 2017�2025(Thousand Units)
Table 71 EVCS Market for Commercial Installation, By Charging Station, 2017�2025(USD Billion)
Table 72 EVCS Market for Commercial Installation, By Region, 2017�2025(USD Million)
Table 73 EVCS Market for Commercial Installation, By Region, 2017�2025(Thousand Units)
Table 74 EV Market, By Region, 2017�2025(USD Billion)
Table 75 EV Market, By Region, 2017�2025(Thousand Units)
Table 76 EVCS Market, By Region, 2017�2025(USD Million)
Table 77 EVCS Market, By Region, 2017�2025(Thousand Units)
Table 78 EV Market in North America, By Country, 2017�2025(USD Million)
Table 79 EV Market in North America, By Country, 2017�2025(Thousand Units)
Table 80 EVCS Market in North America, By Country, 2017�2025(USD Million)
Table 81 EVCS Market in North America, By Country, 2017�2025(Thousand Units)
Table 82 EV Market in North America, By Vehicle Type, 2017�2025(USD Billion)
Table 83 EV Market in Europe, By Country, 2017�2025(USD Billion)
Table 84 Market in Europe, By Country, 2017�2025(Thousand Units)
Table 85 EVCS Market in Europe, By Country, 2017�2025(USD Million)
Table 86 EVCS Market in Europe, By Country, 2017�2025(Thousand Units)
Table 87 EV Market in Europe, By Vehicle Type, 2017�2025(USD Billion)
Table 88 EV Market in APAC, By Country, 2017�2025(USD Billion)
Table 89 EV Market in APAC, By Country, 2017�2025(Thousand Units)
Table 90 EVCS Market in APAC, By Country, 2017�2025(USD Million)
Table 91 EVCS Market in APAC, By Country, 2017�2025(Thousand Units)
Table 92 EV Market in APAC, By Vehicle Type, 2017�2025(USD Billion)
Table 93 EV Market in RoW, By Region, 2017�2025(USD Million)
Table 94 EV Market in RoW, By Region, 2017�2025(Thousand Units)
Table 95 EVCS Market in RoW, By Region, 2017�2025(USD Million)
Table 96 EVCS Market in RoW, By Region, 2017�2025(Thousand Units)
Table 97 EV Market in RoW, By Vehicle Type, 2017�2025(USD Million)
Table 98 Ranking of Top 5 Players: Electric Vehicle Charging Stations Market, 2019
Table 99 Contracts & Acquisitions, 2017�2019
Table 100 Collaborations and Partnerships, 2017�2019
Table 101 Product Launches, 2017�2019
Table 102 Expansions, 2017�2019
List of Figures (60 Figures)
Figure 1 Electric Vehicle Market Segmentation
Figure 2 Electric Vehicle Charging Stations Market Segmentation
Figure 3 Electric Vehicle Charing Stations Market: Research Design
Figure 4 Bottom-Up Approach to Arrive at Market Size
Figure 5 Top-Down Approach to Arrive at the Market Size
Figure 6 Data Triangulation
Figure 7 Assumptions of Research Study
Figure 8 Electric Vehicle Market Segmentation
Figure 9 BEV Expected to Hold Larger Size of EV Market in 2020
Figure 10 APAC to Hold the Largest Share of Electric Vehicle Market in 2020
Figure 11 Electric Vehicle Charging Stations Market Segmentation
Figure 12 Market for DC Charging Expected to Grow at the Highest CAGR During the Forecast Period
Figure 13 Market for Commercial Installation of Electric Vehicle Charging Station Expected to Grow at A Higher CAGR Between 2020 and 2025
Figure 14 APAC to Hold the Largest Share of Electric Vehicle Charging Stations Market in 2020
Figure 15 Battery Electric Vehicle (BEV) Market to Grow at A Higher CAGR Between 2020 and 2025
Figure 16 Government Incentives to Boost the Adoption of EV Charging Stations
Figure 17 Market for DC Charging Station Expected to Be the Largest During 2020�2025
Figure 18 DC Charging Stations Market for Commercial Installation to Hold the Largest Share of the Overall Market in 2020
Figure 19 China to Hold the Largest Share of the Electric Vehicle Charging Stations Market in 2020
Figure 20 DROCs: Electric Vehicle Charging Stations Market, 2018
Figure 21 BEVs and PHEVs Sold During 2010�2017
Figure 22 Working of V2G Charing Station
Figure 23 Major Value is Added During the Manufacturing and Assembly Stage
Figure 24 Types of Electric Vehicle Battery
Figure 25 EV Market Segmentation, By Vehicle Type
Figure 26 APAC to Lead the BEV Market During the Forecast Period
Figure 27 PHEV Market in APAC Expected to Grow at the Highest CAGR Between 2020 and 2025
Figure 28 Market Segmentation, By Charging Station
Figure 29 DC Charging Station Expected to Hold the Largest Share of the Overall Market During the Forecast Period
Figure 30 Commercial Installations Expected to Dominate the AC Charging Stations Market Between 2020 and 2025
Figure 31 Level 1 Charging Stations Market in APAC Estimated to Grow at the Highest CAGR During the Forecast Period
Figure 32 Commercial Installations Estimated to Lead the Level 2 Charging Stations Market During the Forecast Period
Figure 33 APAC Estimated to Lead the DC Charging Stations Market During the Forecast Period
Figure 34 Standards of Electric Vehicle Charging Stations
Figure 35 Number of Chademo Installations, 2010�2018
Figure 36 Market Segmentation, By Installation Type
Figure 37 APAC Expected to Lead the EVCS Market for Residential Installation
Figure 38 Commercial Installation Market in APAC Estimated to Grow at the Highest CAGR During the Forecast Period
Figure 39 Electric Vehicle Charging Stations Market in China Expected to Grow at the Highest CAGR During the Forecast Period
Figure 40 APAC is Expected to Hold the Largest Size of the Electric Vehicle Charging Stations Market During the Forecast Period
Figure 41 Snapshot: Electric Vehicle Charging Stations Market in North America
Figure 42 US Expected to Hold the Largest Share of EV Market in North America Between 2020 and 2025
Figure 43 Electric Vehicle Charging Stations Market in Canada Expected to Grow at the Highest CAGR Between 2020 and 2025
Figure 44 Snapshot: Electric Vehicle Charging Stations Market in Europe
Figure 45 EVCS Market in the UK Expected to Grow at the Highest CAGR Between 2020 and 2025
Figure 46 BEV Expected to Hold A Larger Share of the EV Market in Europe During the Forecast Period
Figure 47 Snapshot: Electric Vehicle Charging Stations Market in APAC
Figure 48 China Expected to Grow at the Highest CAGR Between 2020 and 2025
Figure 49 Electric Vehicle Charging Stations Market in RoW
Figure 50 Africa Expected to Grow at A Higher CAGR During the Forecast Period
Figure 51 Key Players Adopted Contracts and Acquisitions as Key Growth Strategies Between 2017 and 2019
Figure 52 Market Evolution Framework: Contracts and Acquisitions Fueled the Growth of the Electric Vehicle Charging Stations Market During 2017�2019
Figure 53 Contracts and Acquisitions have Been the Key Strategies Between 2017 and 2019
Figure 54 ABB: Company Snapshot
Figure 55 Aerovironment: Company Snapshot
Figure 56 Engie: Company Snapshot
Figure 57 Tesla: Company Snapshot
Figure 58 Schneider Electric: Company Snapshot
Figure 59 Siemens: Company Snapshot
Figure 60 Efacec: Company Snapshot
The study involved 4 major activities in estimating the current size of the electric vehicle charging stations market. Exhaustive secondary research was done to collect information on the market, the peer markets, and the parent market. The next step was to validate these findings, assumptions, and sizing with industry experts across the value chain through primary research. Both top-down and bottom-up approaches were employed to estimate the complete market size. Thereafter, market breakdown and data triangulation were used to estimate the market size of segments and subsegments.
Secondary Research
Secondary sources referred to in this research study include corporate filings (such as annual reports, investor presentations, and financial statements); trade, business, and professional associations; white papers, electric vehicle charging stations-related journals, IEST publications; directories; and databases. The secondary data has been collected and analyzed to arrive at the overall market size estimations, which has been further validated by primary research.
Primary Research
In the primary research process, various primary sources from both supply and demand sides have been interviewed to obtain qualitative and quantitative information relevant to this report. Extensive primary research has been conducted after understanding and analyzing the electric vehicle charging stations market through secondary research. Several primary interviews have been conducted with key opinion leaders from both demand- and supply-side vendors across 4 regions: North America, Europe, Asia Pacific (APAC), and Rest of the World (RoW). RoW comprises Middle East and Africa. Approximately 25% of the primary interviews have been conducted with the demand side and 75% with the supply side. This primary data has been collected mainly through telephonic interviews, which accounted for 80% of the total primary interviews. Besides, questionnaires and emails were also used to collect the data.

To know about the assumptions considered for the study, download the pdf brochure
Market Size Estimation
Both top-down and bottom-up approaches were implemented to estimate and validate the total size of the electric vehicle charging stations market. These methods were also used extensively to estimate the size of the markets based on various subsegments. The research methodology used to estimate the market size includes the following steps:
- The key players in the industry and markets have been identified through extensive secondary research.
- The industry�s supply chain and market size, in terms of value, have been determined through primary and secondary research processes.
- All percentage shares, splits, and breakdowns have been determined using secondary sources and verified through primary sources.
Data Triangulation
After arriving at the overall market size�using the market size estimation processes as explained above�the market was split into several segments and subsegments. To complete the overall market engineering process and arrive at the exact statistics of each market segment and subsegment, data triangulation and market breakdown procedures were employed, wherever applicable. The data was triangulated by studying various factors and trends from the demand and supply sides across different end-use applications.
Study Objectives
- To describe and forecast the electric vehicle charging stations market, in terms of value, segmented on the basis of vehicle type, charging station, installation type and region
- To describe and forecast the market size with respect to 4 main regions, namely, North America, Europe, Asia Pacific (APAC), and Rest of the World (RoW)
- To provide detailed information regarding the major factors such as drivers, restraints, opportunities, and challenges influencing the growth of the market
- To strategically analyze micromarkets1 with respect to individual growth trends, prospects, and their contribution to the overall market
- To analyze opportunities in the market for stakeholders and provide a detailed competitive landscape of the market
- To strategically profile the key players in the market and comprehensively analyze their market ranking and core competencies2
- To analyze competitive developments such as product launches/developments, partnerships, expansions, and Research & Development (R&D) activities carried out by players in the Electric vehicle charging stations market
Available Customizations
With the given market data, MarketsandMarkets offers customizations according to a company's specific needs. The following customization options are available for this report:
Regional Analysis
- Country-wise breakdown for different segments (By Vehicle Type, Charging Station and Installation Type) in North America, Europe, Asia Pacific, and RoW
Company Information
- Detailed analysis and profiling of additional market players (up to 5)


Growth opportunities and latent adjacency in Electric Vehicle Charging Stations Market
The growing need for EVs in various parts of the world is expected to increase the demand for charging stations. As a result, various governments are funding for the development of charging station infrastructure, as well as subsidizing the EV charging infrastructure. Does your report covers regulatory scenario of EV charging station market?
Heavy investments from makers of EVs are expected to play a major role in the evolution of the electric vehicle charging stations market. Tesla, Volkswagen, Mahindra & Mahindra, Ford, Nissan, BMW, and General Motors have huge R&D budgets for the development of EVs. Do you have detailed coverage about investments made by automakers in the ecosystem?
ICE vehicles emit a high volume of carbon gas that is released into atmosphere, creating pollution and greenhouse gases. To reduce pollution, governments of several countries are taking initiatives for the deployment of EVs for future. This would help in improving the air quality. Does your report cover the government acts for environmental pollution control across geographies?
The widespread use of battery electric vehicles (BEVs) and plug-in hybrid electric vehicles (PHEVs) has led to an increase in the number of installations of EV charging stations. So it is important for us to have detailed information about the growth and demand scenario of electric vehicles (EVs). Does your report covers details about EV market in US, Europe, and China?
Standardization of EV charging technology has emerged as the crucial point for the development of electric vehicles. Governments need to standardize charging infrastructure for the development of a favorable ecosystem and increasing the sales of EVs. I am looking for information on EV charging market, different industry standards, and business models with particular focus on the UK.