Laser Processing Market (2013 � 2018): By Technology (Co2, ND: YAG, Fiber Laser); Process (Engraving, Marking, Cutting, Drilling); Base Material (Metals, Polymers); Application (Electronics, Machine Part Marking, Medical, Signage) & Geography


Since its advent in 1957, the early adopters of laser (light amplification by simulated emission of radiation) technology were applications such as; ranging, targeting, spectroscopy, and microscopy. The purpose of these applications was either the exploration/measurement of distances or the scientific/laboratory experiments. None of the above mentioned application promoted laser technology on the commercial front such as laser processing. However, with the technological developments, lasers became compact, robust, and versatile. Such developments triggered the industrial and commercial applications such as; micro-machining, modeling, precise sculpting, shaping & sizing objects and materials, and contactless imprinting which now are collectively referred to as laser processing applications.
The revenue generated from laser processing applications is supported by five critical pillars - laboratory equipments, defense & military, compact disc read/write heads, communications, and material processing. The research study, Laser Processing Market (2013 - 2018) analyses the vital material processing segment. The analysis is complemented by qualitative as well as quantitative data; latter being further divided into sales value, sale volume, and average selling price (ASP) data sets. Each of the data set contains historical, estimated, and forecasted values. The total market is segmented according to the technology, techniques, machine configuration, vertical, and geography.
Segmentation is done considering the supply side as well as the demand side market parameters. Segments such as technology, techniques, and machine configuration define the supply side market, whereas, vertical, application, and geography segments define the demand side market. The technology segmentation divides the market according to the various laser technologies such as CO2 laser, solid state lasers, fiber lasers, and excimer lasers. On the other hand, the machine configuration segment describes how the above mentioned lasers are used. Three types of configurations; moving material, flying optics, and hybrid, along with the mode of operation are covered in the report. Depending on the material type, lasers can be used in continuous mode or in a pulsed mode. The laser market data covered for various technology segments is mutually exclusive.
The major supply side segment is the technique which includes laser cutting, laser drilling, laser engraving, and laser marking. These four types of techniques have replaced the tradition mechanical processing techniques on a large scale. Depending on the application, base material type, and laser type, one can select a suitable laser processing technique. Though, techniques are different, the application market for each type wont be mutually exclusive since multiple techniques may be applied to same the product/application. The chapter also includes the level-2 segmentation of the techniques, giving descriptive data sets for various types of drilling (single pulse, percussion, trepanning, helical), cutting (fusion, flame, sublimation), and marking (masking, carbon migration, bonding).
Amongst the demand side segments, application segment is of the prime importance. The report discusses various applications with their respective impacts on the total market, cannibalization factor, year-on-year growth trend, and TAM/SAM data. Laser processing applications are also divided according to the processing techniques employed, allowing the reader to analyze each of the micro-markets individually. For example, the report differentiates between the automotive application market for laser drilling and automotive application market for laser cutting. Apart from the automotive segments, other major verticals considered for the analysis are aerospace, architecture, commercial, consumer electronics, and semiconductor & electronics.
The report also segments the market by various economic pockets such as; North America, Europe, APAC, and ROW. Further, major countries contributing to the market are analyzed with detailed representation of value and volume data. Apart from the quantitative data, the report also includes qualitative data analysis by the use of various tools and models. Porters five force analysis, value chain analysis, price trend analysis, market dynamics, burning issues, and winning imperatives are few of the analysis models used.
Competitive landscape, along with the recent developments in laser processing market is also discussed in the report. The major companies covered in the report are; Epilog Laser (U.S.), Universal Laser Systems (U.S.), Trotec Laser, Inc (U.S.), Needham-laser (U.K.), SEI Laser (Italy), Eurolaser (Germany), LaserStar (U.S.), and Xenetech Global, Inc (U.S.).
The material processing history dates back to the primates. Since then, various methods of processing are used to manufacture devices, equipments, and tools. Currently, the mechanical processing techniques such as cutting, drilling using bits, engraving using physical force are being extensively used. However, these techniques are now facing a huge competition from the laser material processing techniques. Lasers are used instead of mechanical tool to carry out the processes. Due their advantages such as; speed, accuracy, precision, and low cost of ownership, laser are experiencing heavy adoption in industrial applications.
Lasers have been around since 1957, but no application promoted laser technology on the commercial front. However, with the technological developments, lasers became compact, robust, and versatile. Such developments triggered the industrial and commercial applications such as; micro-machining, modeling, precise sculpting, shaping & sizing objects and materials, and contactless imprinting.
The laser processing market segmentation revolves around five major verticals; technology, process, machine configuration, industry vertical, and geography. Each of the verticals is further segmented into individual sub-segments. The industry vertical segment covers major applications such as aerospace, architecture, automobile, commercial, consumer electronics, general machine tooling, and semiconductor & electronics. Revenue grossed from all the applications mentioned above totaled to approximately $2 billion. Apart from the demand side market drivers, the report also analyzes the supply side drivers. One of the major supply side market drivers is the emergence of BSI technology.
The laser processing market analyses and includes the datasets for lasers, which is not to be confused with the laser systems. The report includes only the laser source market and not the entire laser system or laser machine market. Nevertheless, the report gives a technology-wise comparison of laser sources and laser systems. In 2012, the total laser source revenue for processing market was approximately 29% of the total laser system revenue for the same application.
The technology segmentation includes various laser types such as CO2 lasers, excimer lasers, solid state lasers, fiber lasers, and semiconductor lasers. The technology market is also divided according to the gain medium used in the laser. Three types, gas, solid, and semiconductor gain mediums are considered for the analysis. Total market is fragmented into four regions; North America, Europe, APAC, and ROW. APAC region is further broken in China, Japan, South Korea, and Rest of the APAC.
The following table gives an overview of total laser processing market. The data analysis is done from 2012 to 2018.
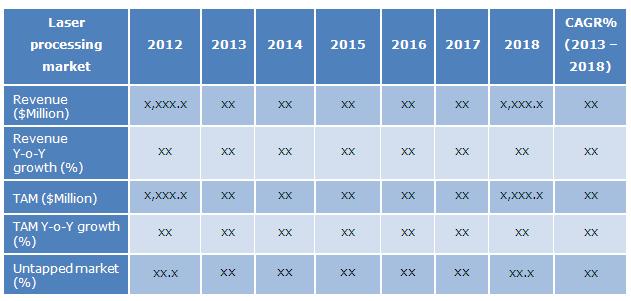
Source: MarketsandMarkets Analysis
The table above gives an overview of the total laser processing market segmented along with TAM and the untapped market potential. The expected CAGR for the market is xx% from 2013 to 2018. The solid CAGR will bring the untapped market potential from xx% in 2012 to xx% in 2018. This indicates the increase in adoption of the laser technologies.
Few of the major companies profiled in the report Coherent, Inc. (U.S.), Epilog Laser, Inc. (U.S.), IPG Photonics Corporation (U.S.), Needham Laser Ltd. (U.K.), Rofin-Sinar Technologies, Inc. (U.S.), and TRUMPF Laser GmbH (Germany).
Table Of Contents
1 Introduction (Page No. - 18)
1.1 Key Take-Aways
1.2 Report Description
1.3 Markets Covered
1.4 Stakeholders
1.5 Report Assumptions
1.6 Research Methodology
1.6.1 Market Size Estimation
1.6.2 Market Crackdown And Data Triangulation
1.6.3 Key Data Points Taken From Secondary Sources
1.6.4 Key Data Points Taken From Primary Sources
1.6.5 List Of Major Companies And Organizations Covered In Primary Research
2 Executive Summary (Page No. - 29)
3 Cover Story (Page No. - 32)
4 Market Overview (Page No. - 35)
4.1 Introduction
4.2 Market Definition Andscope
4.3 Market Segmentation
4.4 History And Evolution Of Laser Processing Market
4.5 Technology And Application Trends
4.6 Advantages Of Laser Material Processing
4.7 The Industrial Safety Factors
4.7.1 Maximum Permissible Exposure (MPE) Levels
4.7.2 Classification
4.7.2.1 By IEC Standard
4.7.2.2 By ANSI Standard
4.8 Market Dynamics
4.8.1 Drivers
4.8.1.1 Government Regulations For Compulsory Use Of Laser Marking
4.8.1.2 Outclassing Every Other Substitute Tools
4.8.1.3 Demand For The Aesthetics
4.8.1.4 Emerging Application In Oil And Gas Exploration Field
4.8.1.5 The Introduction Of Direct Diode Lasers
4.8.2 Restraints
4.8.2.1 High Initial Investment And High Maintenance Cost
4.8.2.2 Eurozone Crises
4.8.2.3 Rare Earth Elements Mining: Environmental Concerns
4.8.3 Opportunities
4.8.3.1 High Adoption Of Disk Lasers
4.8.3.2 Automotive Lights
4.8.3.3 Other Emerging Applications And Processes
4.9 Burning Issues
4.9.1 Technical Challenges With High Power Lasers
4.9.2 Safety Issues With Lasers
4.10 Winning Imperatives
4.10.1 Product Innovation Is The Key
4.10.2 Vertical Consolidation
4.10.3 Laser Doping Of Solar Cells (Lassol): Technology For Solar Cells
4.11 Porter's Five Forces Model
4.11.1 Threat From New Entrants
4.11.2 Threat From Substitutes
4.11.3 Bargaining Power Of Suppliers
4.11.4 Bargaining Power Of Buyers
4.11.5 Degree Of Competition
4.12 Value Chain
4.13 Price Trend Analysis
5 Segmentation By Technology (Page No. - 74)
5.1 Introduction
5.2 Lasers Source And Laser System Market Comparison
5.3 Gas Lasers
5.3.1 Co2 Lasers
5.3.2 Excimer Lasers
5.4 Solid State Lasers
5.4.1 ND:YAG Laser
5.4.2 ER: YAG Laser
5.5 Fiber Lasers
5.6 Semiconductor Lasers
6 Segmentation By Process (Page No. - 100)
6.1 Introduction
6.2 Cutting And Drilling
6.2.1 Cutting
6.2.1.1 Fusion Cutting
6.2.1.2 Flame Cutting
6.2.1.3 Sublimation Cutting
6.2.2 Drilling
6.2.2.1 Single Pulse Drilling
6.2.2.2 Percussion Drilling
6.2.2.3 Trepanning Drilling
6.2.2.4 Helical Drilling
6.3 Marking And Engraving
6.3.1 Direct Laser Engraving
6.3.2 Direct Photopolymer Laser Imaging
6.3.3 Sub Surface Laser Engraving
6.4 Micro-Processing
6.5 Advanced Processing
7 Segmentation By Machine Configuration (Page No. - 121)
7.1 Introduction
7.2 Types Of Configuration For Laser Cutting
7.2.1 Moving Material Laser Configuration
7.2.2 Flying Optics Systems Laser Configuration
7.2.3 Hybrid Laser Configuration
7.3 Types Of Configuration For Laser Engraving
7.3.1 X-Y Surface Based
7.3.2 Cylindrical Work Pieces
7.3.3 Stationed Laser Machine
8 Segmentation By Vertical (Page No. - 129)
8.1 Introduction
8.2 Aerospace
8.3 Architecture
8.3.1 Architecture Vertical Segmentation By Process
8.4 Automotive
8.4.1 Automotive Vertical Segmentation By Process
8.5 Commercial
8.5.1 Commercial Vertical Segmentation By Process
8.5.2 Commercial Vertical Segmentation By Application
8.6 Consumer Electronics
8.6.1 Consumer Electronic Vertical Segmentation By Application
8.7 General Machine Tooling
8.7.1 General Machine Tooling Vertical Segmentation By Process
8.7.2 General Machine Tooling Vertical Segmentation By Application
8.8 Semiconductor & Electronics
8.8.1 Semiconductor & Electronics Vertical Segmentation By Process
8.8.2 Semiconductor & Electronics Vertical Segmentation By Application
9 Segmentation By Geography (Page No. - 148)
9.1 Introduction
9.2 North America
9.3 Europe
9.4 APAC
9.5 Row
10 Competitive Landscape (Page No. - 155)
10.1 Overview
10.2 Market Share Analysis
10.3 Key Growth Strategies
10.4 Competitive Situation And Trends
10.4.1 New Product Developments & Announcements
10.4.2 Agreements, Partnerships, Joint Ventures And Collaborations
10.4.3 Mergers And Acquisitions
11 Company Profiles (Overview, Products & Services, Financials, Strategy And Developments)* (Page No. - 168)
11.1 Alltec GMBH
11.2 Alpha Nov Laser
11.3 Bystronic, Inc.
11.4 Coherent, Inc.
11.5 DPSS Laser, Inc.
11.6 Epilog Laser, Inc.
11.7 Eurolaser GMBH
11.8 IPG Photonics Corporation
11.9 Jenoptik Laser GMBH
11.10 Laserstar Technologies Corporation
11.11 Needham Laser Ltd.
11.12 Newport Corporation
11.13 Prima Industrie S.P.A.
11.14 Q-Peak, Inc.
11.15 Rofin-Sinar Technologies, Inc.
11.16 SEI Laser S.P.A
11.17 Trotec Laser, Inc.
11.18 Trumpf Laser GMBH + Co. Kg
11.19 Universal Laser Systems, Inc.
11.20 Xenetech Global, Inc.
*Details On Overview, Products & Services, Financials, Strategy And Developments Might Not Be Captured In Case Of Unlisted Companies.
List Of Tables (90 Tables)
Table 1 General Assumptions, Terminology And Application Key Notes
Table 2 Global Laser Processing Market, 2012 � 2018 ($Million)
Table 3 Comaprison Of Processes By, Verticals, 2012
Table 4 Laser Processing Vs Mechanical Processing, 2013
Table 5 Average Selling Price Of Lasers, By Technology, 2012 ($)
Table 6 Pump Source Key Manufacturers And Suppliers, 2013
Table 7 Laser Cavity Key Manufacturers And Suppliers, 2013
Table 8 Laser Electronic Component Key Manufacturers And Suppliers, 2013
Table 9 Laser Optics Key Manufacturers And Suppliers, 2013
Table 10 Laser Electronic Shutter Key Manufacturers And Suppliers, 2013
Table 11 Price Analysis Of Lasers, By Technology, 2012 � 2018 ($/Watt)
Table 12 Global Market Revenue, By Technology, 2012 � 2018 ($Billion)
Table 13 Global Market Revenue, By Technology, 2012 � 2018 ($Million)
Table 14 Global Market Revenue, By Gain Medium, 2012 -2018 ($Million)
Table 15 Advantages Of Co2 Lasers
Table 16 Difference Between Co2 Laser And Fiber Laser
Table 17 Global Co2 Laser Processing Market Revenue, 2012 � 2018
Table 18 Global Co2 Laser Market Share, By Process,2012 - 2018 ($Million)
Table 19 Types Of Excimer Lasers
Table 20 Global Excimer Laser Processing Market Revenue,2012 � 2018 ($Million)
Table 21 Global Excimer Market Share, By Process, 2012 � 2018 ($Million)
Table 22 Global Solid State Laser Processing Market Revenue,2012 � 2018 ($ Million)
Table 23 Global Solid State Market Share,By Applications, 2012 � 2018 ($Million)
Table 24 Advantages Of Fiber Laser
Table 25 Global Fiber Laser Processing Market Revenue,2012 � 2018 ($Million)
Table 26 Global Fiber Market Share, By Applications, 2012 � 2018 ($Million)
Table 27 Global Semiconductor Laser Processing Market Revenue, 2012 � 2018 ($Million)
Table 28 Global Market Share,By Applications, 2012 � 2018, ($Million)
Table 29 Global Market, By Applications,2012 � 2018 ($Million)
Table 30 Global Cutting And Drilling Process Market, By Technology, 2012 - 2018 ($Million)
Table 31 Types Of Laser And Their Applications
Table 32 Global Laser Cutting Process Market, By Vertical,2012 - 2018 ($Million)
Table 33 Global Laser Cutting Market, By Application, 2012 � 2018 (%)
Table 34 Global Laser Drilling Process Market, By Vertical,2012 - 2018 ($Million)
Table 35 Global Laser Drilling Market, By Application, 2012 � 2018 (%)
Table 36 Global Marking And Engraving Process Market,By Technology, 2012 - 2018 ($Million)
Table 37 Global Laser Marking & Engraving Market, By Application, 2012 � 2018 (%)
Table 38 Global Laser Marking And Engraving Process Market,By Vertical, 2012 - 2018 ($Million)
Table 39 Global Micro-Processing Market Revenue, By Technology, 2012 � 2018 ($Million)
Table 40 Global Laser Micro-Processing Market, By Vertical,2012 - 2018 ($Million)
Table 41 Global Laser Micro-Processing Market, By Application,2012 � 2018 (%)
Table 42 Global Advanced Processing Market, By Technology,2012 - 2018 ($Million)
Table 43 Global Laser Advanced Processing Market, By Vertical,2012 - 2018 ($Million)
Table 44 Comparison Of Different Laser Cutting Configurations
Table 45 Global Market, By Machine Configuration, 2012 � 2018 ($Million)
Table 46 Global Market Revenue,2012 � 2018 ($Million)
Table 47 Global Market Revenue, By Verticals,2012 � 2018 ($Million)
Table 48 Global Market Revenue, By Aerospace,2012 � 2018 ($Million)
Table 49 Global Market Revenue, By Architecture, 2012 � 2018 ($Million)
Table 50 Global Architecture Laser Processing Market Revenue,By Process, 2012 - 2018, ($Million)
Table 51 Global Market Revenue, By Automotive, 2012 � 2018 ($Million)
Table 52 Global Automotive Laser Processing Market Revenue,By Process, 2012 - 2018 ($Million)
Table 53 Global Market Revenue, By Commercial, 2012 � 2018 ($Million)
Table 54 Global Commercial Laser Processing Market Revenue,By Process, 2012 - 2018 ($Million)
Table 55 Global Commercial Market Revenue,By Applications, 2012 - 2018 ($Million)
Table 56 Global Market Revenue, By Consumer Electronics, 2012 � 2018 ($Million)
Table 57 Global Consumer Electronics Laser Processing Market Revenue, By Process, 2012 - 2018 ($Million)
Table 58 Global Market Revenue, By General Machine Tooling, 2012 � 2018 ($Million)
Table 59 Global General Machine Tooling Laser Processing Market Revenue, By Process, 2012 - 2018 ($Million)
Table 60 Global General Machine Tooling Market Revenue, By Application, 2012 - 2018 ($Million)
Table 61 Global Market Revenue, By Semiconductor & Electronics, 2012 � 2018 ($Million)
Table 62 Global Semiconductor & Electronics Laser Processing Market Revenue, By Process, 2012 - 2018 ($Million)
Table 63 Global Semiconductor & Electronics Market Vertical Revenue, By Applications,2012 - 2018 ($Million)
Table 64 Global Market Revenue,2012 � 2018 ($Million)
Table 65 North America: Laser Processing Market, By Process,2012 � 2018 (%)
Table 66 Europe: Laser Processing Market, By Process, 2012 � 2018 (%)
Table 67 APAC: Laser Processing Market, By Process, 2012 � 2018 (%)
Table 68 APAC Market Segmentation, By Country, 2012 � 2018 ($Million)
Table 69 Row: Laser Processing Market, By Process, 2012 � 2018 (%)
Table 70 Laser Processing Market: Market Share Analysis, 2012
Table 71 New Product Launch/Development, 2010 � 2013
Table 72 Agreements, Partnerships, Joint Ventures & Collaborations, 2010 � 2012
Table 73 Mergers & Acquisitions, 2010 � 2012
Table 74 Coherent: Overall Revenue, 2011 - 2012 ($Million)
Table 75 Coherent: Market Revenue, By Segments,2011 - 2012 ($Million)
Table 76 Coherent: Market Revenue, By Geography,2011 - 2012 ($Million)
Table 77 Eurolaser: Overall Revenue, 2011 - 2012 ($Million)
Table 78 IPG Photonics: Overall Revenue, 2011 - 2012 ($Million)
Table 79 IPG Photonics: Market Revenue, By Segments,2011 - 2012 ($Million)
Table 80 IPG Photonics: Market Revenue, By Geography,2011 - 2012 ($Million)
Table 81 Newport: Overall Revenue, 2011 - 2012 ($Million)
Table 82 Newport: Market Revenue, By Segments, 2011 - 2012 ($Million)
Table 83 Newport: Market Revenue, By Geography,2011 - 2012 ($Million)
Table 84 Prima Industrie S.P.A. Overall Revenue, 2011 � 2012 ($Million)
Table 85 Prima Industrie S.P.A. Market Revenue, By Segments,2011 � 2012 ($Million)
Table 86 Prima Industrie S.P.A. Market Revenue, By Geography,2011 � 2012 ($Million)
Table 87 Rofin-Sinar Technologies: Overall Revenue,2011 - 2012 ($Million)
Table 88 Rofin-Sinar Technologies: Market Revenue, By Segments,2011 - 2012 ($Million)
Table 89 Rofin-Sinar Technologies: Market Revenue, By Geography, 2011 - 2012 ($Million)
Table 90 SEI Laser: Overall Revenue, 2010-2011 ($Million)
List Of Figures (33 Figures)
Figure 1 Markets Covered For Analysis
Figure 2 Market Research Methodology
Figure 3 Market Crackdown And Data Triangulation
Figure 4 Laser Operating Modes
Figure 5 Elements Of Laser
Figure 6 Types Of Laser
Figure 7 Market Segmentation By Suppliers Side
Figure 8 Market Segmentation By Demand Side
Figure 9 Invention Of Major Laser Processing Technologies
Figure 10 Evolution Of Laser Technology
Figure 11 Revised System As Per IEC Standard
Figure 12 Laser System As Per ANSI (U.S.) Standard
Figure 13 Porter�s Five For Analysis Of Laser Processing Market, 2012
Figure 14 Laser Processing Market: Threats From New Entrants, 2012
Figure 15 Market: Threats From Substitutes, 2012
Figure 16 Market: Bargaining Power Of Suppliers, 2012
Figure 17 Market: Bargaining Power Of Buyers, 2012
Figure 18 Market: Degree Of Competition, 2012
Figure 19 Value Chain Of Laser Systems, 2013
Figure 20 Laser Source Revenue And Laser System Revenue Comparison, 2012
Figure 21 Carbon Dioxide (Co2) Laser Setup
Figure 22 Solid State Laser Setup
Figure 23 Fiber Laser Setup
Figure 24 Fiber Bragg Gratings (FBG)
Figure 25 Types Of Laser Cutting
Figure 26 Types Of Laser Drilling
Figure 27 Factors Determining Laser Machine
Figure 28 Key Growth Strategies
Figure 29 DPSS Lasers: Product Line
Figure 30 DPSS Lasers: Applications
Figure 31 Laser Process: Epilog Laser Product Line
Figure 32 Rofin-Sinar Technologies: Business Segment
Figure 33 Trumpf Laser: Product Line


Growth opportunities and latent adjacency in Laser Processing Market