Non-Destructive Testing (NDT) Market by Component (Equipment, Services) Method (Ultrasonic, Radiography, Liquid Penetrant, Magnetic) End-User (Oil & Gas, Aerospace & Defense, Automotive, Infra) Technique, Application & Region - Global Forecast to 2022


The non-destructive testing (NDT) market is estimated to be USD 15.06 Billion in 2016 and is projected to reach USD 24.23 Billion by 2022, at a CAGR of 8.24% from 2016 to 2022. 2015 is considered as the base year and the forecast period for this report is from 2016 to 2022. Non-destructive testing techniques are increasingly utilized by varied industries such as aerospace, oil & gas, petroleum, and construction, among others. Innovations in the non-destructive testing market have increased commercially after the introduction of advanced X-ray equipment, such as micro focus X-ray tools, integrated X-ray equipment, glass X-ray tubes with window, and radiation shielded X-ray equipment, among others. Advancements in the field of non-destructive testing have further offered huge growth potential for technologies such as computed tomography, phased array ultrasonic testing, and data management tools, as these techniques are used to derive highly accurate results.
Non-destructive testing market report provides qualitative and quantitative information about the non-destructive testing market. It identifies the market application gaps, emerging technologies, the need for new product launches, and high potential geographic regions & countries. It also provides insights on the market size, market share, revenue projections, and financial portfolio. Non-destructive testing market report offers information on different methods, end users, components, applications, and techniques of the non-destructive testing industry.
The research methodology used to estimate and forecast the non-destructive testing market begins with capturing data on key non-destructive testing equipment revenues through secondary sources such as ASNT (The American Society for Nondestructive Testing). The non-destructive testing service offerings are also taken into consideration to determine the market segmentation. The bottom-up procedure was employed to arrive at the overall market size of the non-destructive testing market by estimating the revenue of key players in the market. After arriving at the overall market size, the total market was split into several segments and subsegments, which were then verified through primary research by conducting extensive interviews with key personnel that include CEOs, VPs, directors, and executives. The data triangulation and market breakdown procedures were employed to complete the overall market engineering process and arrive at the exact statistics for all segments and subsegments. The breakdown of profiles of primary participants is depicted in the below figure:
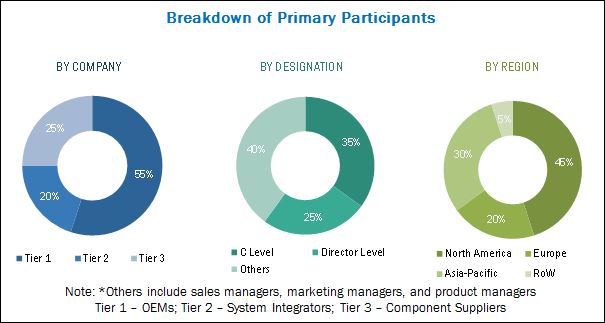
To know about the assumptions considered for the study, download the pdf brochure
The ecosystem of the non-destructive testing market comprises oil exploration companies; oil refineries such as Shell Nederland (Netherlands) and Exxon Mobil Corp. (U.S.); aerospace companies such as Bombardier (Canada) and Airbus SAS (France); construction companies such as Bechtel (U.S.) and TECHNIP (France); inspection service providers such as Olympus Corporation (Japan) and MISTRAS Group, Inc. (U.S.); and non-destructive testing facilities among others.
Target Audience for this Report:
- NDT Equipment Manufacturers
- Original Equipment Manufacturers (OEMs)
- Software Solution Providers
- Component Suppliers
- Aerospace & Defense Industry
- Turbine, Ship Hull, and Aircraft Manufacturers
- Automotive Industry
- Oil & Gas Industry
- Infrastructure Industry
- Power Plants
�This study answers several questions for the stakeholders, primarily which market segments to focus in next two to five years for prioritizing the efforts and investments�.
![]()
Want to explore hidden markets that can drive new revenue in Non-Destructive Testing (NDT) Market?

This research report categorizes the non-destructive testing market into the following segments and subsegments:
NDT Market, By Component
- Equipment
- Services
NDT Market, By Method
- Ultrasonic Testing
- Radiography Testing
- Liquid Penetrant Testing
- Magnetic Particle Testing
- Eddy-current Testing
- Visual Inspection
NDT Market, By End User
- Aerospace & Defense Industry
- Automotive Industry
- Oil & Gas Industry
- Infrastructure Industry
- Power Generation Industry
NDT Market, By Technique
- Surface Examination Technique
- Volumetric Examination Technique
- Condition Monitoring Technique
- Integrity Examination Technique
- Other Non-Destructive Techniques
NDT Market, By Application
- Flaw Detection
- Leak Detection
- Dimensional Measurement
- Estimation of Physical Properties
- Chemical Composition Determination
- Stress & Structure Analysis
NDT Market, By Region
- G7 Nations
- U.S.
- Canada
- Japan
- Italy
- France
- Germany
- U.K.
- BRICS
- Brazil
- Russia
- India
- China
- South Africa
- Rest of the World
- South Korea
- Saudi Arabia
- Others
Available Customizations:
- With the given market data, MarketsandMarkets offers customizations as per specific needs of a company. The following customization options are available for the report:
- Regional Analysis
- Further breakdown of the Rest of the World Non-Destructive Testing Market into Malaysia and New Zealand, among others
- Company Information
- Detailed analysis and profiling of additional market players (Up to 5)
The non-destructive testing (NDT) market is estimated to be USD 15.06 Billion in 2016 and is projected to reach USD 24.23 Billion by 2022, at a CAGR of 8.24% from 2016 to 2022. The market is evolving with the increased demand for error-free production and service delivery in industries, such as infrastructure, automotive, aerospace & defense, industrial manufacturing, power generation, and oil & gas, among others. Strict safety regulations formulated by governments, the need to preserve aging infrastructure, and development of advanced automated non-destructive testing equipment are additional factors driving the growth of this market.
Based on method, the non-destructive testing market has been segmented into visual inspection, ultrasonic testing, radiography, magnetic particle testing, liquid penetrant testing, and eddy-current testing. The ultrasonic testing segment is projected to lead the non-destructive testing market during the forecast period, owing to the increasing demand for this testing method from manufacturing, aerospace & defense, infrastructure, power generation, automotive, and transportation industries. This testing method also helps detect the depth of internal flaws and determine thickness of parts.
Based on end user, the non-destructive testing market has been segmented into aerospace & defense, automotive, oil & gas, infrastructure, and power generation. The aerospace & defense segment is estimated to account for the largest share of the non-destructive testing market in 2016. The increasing demand for non-destructive testing in the aerospace & defense sector is mainly attributed to the fact that NDT helps ensure safety and efficiency in the production process of geometrically complex aircraft components.
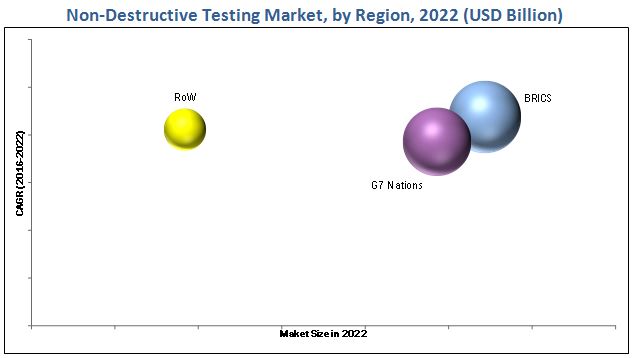
The non-destructive testing market in BRICS is expected to grow at the highest CAGR during the forecast period. Extensive investments in shale oil & gas exploration as well as civil infrastructure, modernizing ports, rebuilding the crumbling infrastructure, rapid industrialization, and increasing investments in the nuclear power generation industry are key factors driving the growth of the non-destructive testing market in BRICS.
The high cost of equipment and lack of qualified technicians are some of the key factors that limit the growth of this market globally. In addition to this, reluctance towards the adoption of new inspection methods poses a key challenge for non-destructive testing equipment manufacturing companies.
The non-destructive testing market is diversified and competitive, with a majority of well-established players from the North American and European regions. Market players focus on entering new markets by launching technologically advanced and cost-effective products, and acquiring new businesses. New product launch is the key strategy adopted by industry players to strengthen their presence in the non-destructive testing market. Key players in this market include MISTRAS Group, Inc. (U.S.), Olympus Corporation (Japan), GE Inspection Technologies (U.S.), Intertek Group PLC (U.K.), and SGS S.A. (Switzerland).
To speak to our analyst for a discussion on the above findings, click Speak to Analyst
Table of Contents
1 Introduction (Page No. - 18)
1.1 Objectives of the Study
1.2 Market Definition
1.3 Study Scope
1.3.1 Markets Covered
1.3.2 Regional Scope
1.3.3 Years Considered for the Study
1.4 Currency & Pricing
1.5 Distribution Channel Participants
1.6 Stakeholders
2 Research Methodology (Page No. - 22)
2.1 Research Data
2.1.1 Secondary Data
2.1.1.1 Key Data From Secondary Sources
2.1.2 Primary Data
2.1.2.1 Key Data From Primary Sources
2.1.2.2 Breakdown of Primaries
2.2 Factor Analysis
2.2.1 Introduction
2.2.2 Demand-Side Indicators
2.2.2.1 Increase in Renewable Energy Use
2.2.2.2 Pipeline Network Safety
2.2.2.3 Growth in Aircraft Fleet Size
2.2.3 Supply-Side Indicators
2.2.3.1 Increased R&D Activities
2.2.3.2 Development of Efficient Materials
2.3 Market Size Estimation
2.3.1 Bottom-Up Approach
2.3.2 Top-Down Approach
2.4 Market Breakdown & Data Triangulation
2.5 Research Assumptions & Limitations
2.5.1 Assumptions
2.5.2 Limitations
3 Executive Summary (Page No. - 37)
4 Premium Insights (Page No. - 42)
4.1 Attractive Opportunities in NDT Market
4.2 NDT Market, By End-User
4.3 NDT Market, By Technique
4.4 Opportunities in NDT Market: Regional Analysis
4.5 NDT Market, By Technique
4.6 BRICS NDT Market, By End-User
4.7 Life Cycle Analysis, By Region
5 Market Overview (Page No. - 47)
5.1 Introduction
5.2 Market Evolution
5.3 Market Segmentation
5.3.1 By Method
5.3.2 By Technique
5.3.3 By Application
5.3.4 By Component
5.3.5 By End-User
5.4 Market Dynamics
5.4.1 Drivers
5.4.1.1 Extending the Useful Life of Aging Infrastructure
5.4.1.2 Outsourcing of Non-Core Activities and Technical Resource Constraints
5.4.1.3 Stringent Safety Regulations Formulated By Governments
5.4.1.4 Emergence of Industrial Internet of Things
5.4.2 Restraints
5.4.2.1 Lack of Skilled Professionals
5.4.2.2 High Cost of Advanced NDT Equipment
5.4.3 Opportunities
5.4.3.1 New Power Generation Projects
5.4.3.2 Integration of Robotic Technology
5.4.3.3 Increasing Use of Advanced Materials
5.4.3.4 Large-Scale Infrastructure Projects
5.4.4 Challenges
5.4.4.1 Price Volatility of Natural Gas and Crude Oil
5.4.4.2 Reluctance to Adopt New NDT Techniques By End-Users
5.4.5 Winning Imperatives
5.4.5.1 Expanding End-User Market
5.4.5.2 Expanding Geographical Reach
5.4.6 Burning Issues
5.4.6.1 Lack of Skilled Workforce and Increasing Mechanical Complications
5.4.6.2 Rapid Industrial Transformation
6 Industry Trends (Page No. - 65)
6.1 Introduction
6.2 Emerging Technology Trends
6.2.1 Cloud Testing: Integrated Innovation Technology
6.2.2 Robotic Integrated Technology
6.2.2.1 Film X-Ray vs Digital Radiography (DR)
6.2.3 Iiot
6.3 Product Launches
6.4 Technological Advancements
6.5 Innovation & Patent Registrations
6.6 NDT Regulatory Bodies, By Region
6.7 Average Selling Price, 2016
7 NDT Market, By Method (Page No. - 76)
7.1 Introduction
7.2 Visual Inspection
7.3 Magnetic Particle Testing (MPT)
7.4 Liquid Penetrant Testing (LPT)
7.5 Ultrasonic Testing
7.6 Radiography Testing
7.7 Eddy Current Testing (ECT)
7.8 Others
7.8.1 Terahertz Imaging
7.8.2 Magnetic Resonance Imaging (MRI)
7.8.3 Acoustic Emission Testing (AET)
7.8.4 Near-Infrared Spectroscopy
7.8.5 Optical Microscopic Testing
7.8.6 Thermographic Testing
8 NDT Market, By Technique (Page No. - 97)
8.1 Introduction
8.2 Surface Examination
8.3 Volumetric Examination
8.4 Condition Monitoring
8.5 Integrity Examination Technique
8.6 Others
9 NDT Market, By Application (Page No. - 107)
9.1 Introduction
9.2 Flaw Detection
9.3 Leak Detection
9.4 Dimensional Measurement
9.5 Physical Properties Determination
9.6 Chemical Composition Determination
9.7 Plasma Emission Spectrography
9.8 Corrosion Resistance Testing
9.9 Stress & Structure Analysis
9.10 Others
10 NDT Market, By Component (Page No. - 117)
10.1 Introduction
10.2 Equipment
10.3 Services
11 NDT Market, By End-User (Page No. - 120)
11.1 Introduction
11.2 Aerospace & Defense
11.3 Automotive
11.4 Oil & Gas
11.5 Infrastructure
11.6 Power Generation
11.7 Others
12 NDT Market, By Region (Page No. - 135)
12.1 Introduction
12.2 G7 Nations
12.2.1 By End-User
12.2.2 By Method
12.2.3 By Technique
12.2.4 By Country
12.2.4.1 U.S.
12.2.4.1.1 By End-User
12.2.4.1.2 By Method
12.2.4.2 Germany
12.2.4.2.1 By End-User
12.2.4.2.2 By Method
12.2.4.3 Japan
12.2.4.3.1 By End-User
12.2.4.3.2 By Method
12.2.4.4 U.K.
12.2.4.4.1 By End-User
12.2.4.4.2 By Method
12.2.4.5 France
12.2.4.5.1 By End-User
12.2.4.5.2 By Method
12.2.4.6 Canada
12.2.4.6.1 By End-User
12.2.4.6.2 By Method
12.2.4.7 Italy
12.2.4.7.1 By End-User
12.2.4.7.2 By Method
12.3 BRICS
12.3.1 By End-User
12.3.2 By Method
12.3.3 By Technique
12.3.4 By Country
12.3.4.1 China
12.3.4.1.1 By End-User
12.3.4.1.2 By Method
12.3.4.2 India
12.3.4.2.1 By End-User
12.3.4.2.2 By Method
12.3.4.3 Russia
12.3.4.3.1 By End-User
12.3.4.3.2 By Method
12.3.4.4 Brazil
12.3.4.4.1 By End-User
12.3.4.4.2 By Method
12.3.4.5 South Africa
12.3.4.5.1 By End-User
12.3.4.5.2 By Method
12.4 RoW
12.4.1 By End-User
12.4.2 By Method
12.4.3 By Technique
12.4.4 By Country
12.4.4.1 Saudi Arabia
12.4.4.1.1 By End-User
12.4.4.1.2 By Method
12.4.4.2 South Korea
12.4.4.2.1 By End-User
12.4.4.2.2 By Method
12.4.4.3 Others
12.4.4.3.1 By End-User
12.4.4.3.2 By Method
13 Competitive Landscape (Page No. - 170)
13.1 Introduction
13.2 Brand Analysis
13.3 Market Share Analysis
13.4 Competitive Situations and Trends
13.4.1 New Product Launches
13.4.2 Acquisitions, Partnerships, Joint Ventures, and Agreements
13.4.3 Contracts
13.4.4 Expansions
14 Company Profiles (Page No. - 185)
(Company Overview, Product/Service Offered, Recent Developments, SWOT Analysis, MnM View)*
14.1 Introduction
14.1.1 Financial Highlights
14.2 Olympus Corporation
14.3 Mistras Group, Inc.
14.4 Intertek Group PLC
14.5 SGS S.A.
14.6 GE Measurement & Control
14.7 Nikon Metrology, Inc.
14.8 Ashtead Technology, Inc.
14.9 Sonatest Ltd.
14.10 Bosello High Technology S.R.L.
14.11 Fujifilm Holdings Corporation
*Details on Company Overview, Product/Service Offered, Recent Developments, SWOT Analysis, MnM View Might Not Be Captured in Case of Unlisted Companies.
15 Appendix (Page No. - 214)
15.1 Discussion Guide
15.2 Knowledge Store: Marketsandmarkets� Subscription Portal
15.3 Introducing RT: Real-Time Market Intelligence
15.4 Available Customizations
15.5 Related Reports
15.6 Author Details
List of Tables (96 Tables)
Table 1 Investments in Renewable Energy, By Country, 2015
Table 2 Total Length of the Pipeline Network, By Country, 2013 (Km)
Table 3 Cost Comparision Between Film X-Ray and DR
Table 4 Recent Product Launches in NDT Market, 2014�2016
Table 5 Recent Technology Trends in NDT Market, By Industry
Table 6 Important Innovation & Patent Registrations, 2011-2016
Table 7 NDT Market Size, By Method, 2014-2022 (USD Million)
Table 8 Types of NDT Methods
Table 9 Visual Inspection Testing: NDT Market, By Region, 2014-2022 (USD Million)
Table 10 MPT: NDT Market, By Region, 2014-2022 (USD Million)
Table 11 LPT: NDT Market, By Region, 2014-2022 (USD Million)
Table 12 Ultrasonic Testing: NDT Market Size, By Region, 2014-2022 (USD Million)
Table 13 Radiography Testing: NDT Market Size, By Region, 2014-2022 (USD Million)
Table 14 ECT: NDT Market, By Region, 2014-2022 (USD Million)
Table 15 Applications of Terahertz Imaging Method, By Industry
Table 16 Applications of MRI Method, By Industry
Table 17 Applications of AET Method, By Industry
Table 18 Applications of Near-Infrared Spectroscopy Method, By Industry
Table 19 Application of Optical Microscopic Testing Method, By Industry
Table 20 Applications of Thermographic Testing, By Industry
Table 21 NDT Techniques for Detection of Surface Cracks
Table 22 NDT Market Size, By Technique, 2014-2022 (USD Million)
Table 23 Surface Examination Technique: NDT Market Size, By Region, 2014-2022 (USD Million)
Table 24 Volumetric Examination Technique: NDT Market Size, By Region, 2014-2022 (USD Million)
Table 25 Condition Monitoring Technique: NDT Market Size, By Region, 2014-2022 (USD Million)
Table 26 Integrity Examination Technique: NDT Market Size, By Region, 2014-2022 (USD Million)
Table 27 Others: NDT Market Size, By Region, 2014-2022 (USD Million)
Table 28 Application of Ultrasonic Transducers for Flaw Detection
Table 29 Flaw Detection Products, By Key Players
Table 30 Techniques for Leak Testing
Table 31 Dimension Measurement Products, By Key Players
Table 32 Techniques Involved in Dimension Evalution
Table 33 Physical Properties Determination Products, By Key Players
Table 34 Ultrasonic Velocity and Concrete Structure Condition
Table 35 Methods for Corrosion Testing, By Category
Table 36 NDT Techniques for Stress & Structures Damages
Table 37 Other Applications of Ndt
Table 38 NDT Market Size, By Component, 2014-2022 (USD Million)
Table 39 NDT Market Size, By Equipment, 2014-2022 (USD Million)
Table 40 NDT Market Size, By Services, 2014-2022 (USD Million)
Table 41 NDT Market Size, By End-User, 2014-2022 (USD Million)
Table 42 NDT Market Future Outlook, By End-User
Table 43 Aerospace & Defense : NDT Market, By Region, 2014-2022 (USD Mn)
Table 44 Automotive: NDT Market Size, By Region, 2014-2022 (USD Million)
Table 45 Oil & Gas: NDT Market Size, By Region, 2014-2022 (USD Million)
Table 46 Infrastructure: NDT Market Size, By Region, 2014-2022 (USD Million)
Table 47 Power Generation: NDT Market Size, By Region, 2014-2022 (USD Million)
Table 48 Others: NDT Market Size, By Region, 2014-2022 (USD Million)
Table 49 NDT Market Size, By Region, 2014-2022 (USD Million)
Table 50 G7 Nations: NDT Market Size, By End-User, 2014-2022 (USD Million)
Table 51 G7 Nations: NDT Market Size, By Method, 2014-2022 (USD Million)
Table 52 G7 Nations: NDT Market Size, By Technique, 2014-2022 (USD Million)
Table 53 G7 Nations: NDT Market Size, By Country, 2014-2022 (USD Million)
Table 54 U.S.: NDT Market Size, By End-User, 2014-2022 (USD Million)
Table 55 U.S.: NDT Market Size, By Method, 2014-2022 (USD Million)
Table 56 Germany: NDT Market Size, By End-User, 2014-2022 (USD Million)
Table 57 Germany: NDT Market Size, By Method, 2014-2022 (USD Million)
Table 58 Japan: NDT Market Size, By End-User, 2014-2022 (USD Million)
Table 59 Japan: NDT Market Size, By Method, 2014-2022 (USD Million)
Table 60 U.K.: NDT Market Size, By End-User, 2014-2022 (USD Million)
Table 61 U.K.: NDT Market Size, By Method, 2014-2022 (USD Million)
Table 62 France: NDT Market Size, By End-User, 2014-2022 (USD Million)
Table 63 France: NDT Market Size, By Method, 2014-2022 (USD Million)
Table 64 Canada: NDT Market Size, By End-User, 2014-2022 (USD Million)
Table 65 Canada: NDT Market Size, By Method, 2014-2022 (USD Million)
Table 66 Italy: NDT Market Size, By End-User, 2014-2022 (USD Million)
Table 67 Italy: NDT Market Size, By Method, 2014-2022 (USD Million)
Table 68 BRICS: NDT Market Size, By End-User, 2014-2022 (USD Million)
Table 69 BRICS: NDT Market Size, By Method, 2014-2022 (USD Million)
Table 70 BRICS: NDT Market Size, By Technique, 2014-2022 (USD Million)
Table 71 BRICS: NDT Market Size, By Country, 2014-2022 (USD Million)
Table 72 China: NDT Market Size, By End-User, 2014-2022 (USD Million)
Table 73 China: NDT Market Size, By Method, 2014-2022 (USD Million)
Table 74 India: NDT Market Size, By End-User, 2014-2022 (USD Million)
Table 75 India: NDT Market Size, By Method, 2014-2022 (USD Million)
Table 76 Russia: NDT Market Size, By End-User, 2014-2022 (USD Million)
Table 77 Russia: NDT Market Size, By Method, 2014-2022 (USD Million)
Table 78 Brazil: NDT Market Size, By End-User, 2014-2022 (USD Million)
Table 79 Brazil: NDT Market Size, By Method, 2014-2022 (USD Million)
Table 80 South Africa: NDT Market Size, By End-User, 2014-2022 (USD Million)
Table 81 South Africa: NDT Market Size, By Method, 2014-2022 (USD Million)
Table 82 RoW: NDT Market Size, By End-User, 2014-2022 (USD Million)
Table 83 RoW: NDT Market Size, By Method, 2014-2022 (USD Million)
Table 84 RoW: NDT Market Size, By Technique, 2014-2022 (USD Million)
Table 85 RoW: NDT Market Size, By Country, 2014-2022 (USD Million)
Table 86 Saudi Arabia: NDT Market Size, By End-User, 2014-2022 (USD Million)
Table 87 Saudi Arabia: NDT Market Size, By Method, 2014-2022 (USD Million)
Table 88 South Korea: NDT Market Size, By End-User, 2014-2022 (USD Million)
Table 89 South Korea: NDT Market Size, By Method, 2014-2022 (USD Million)
Table 90 Others: NDT Market Size, By End-User, 2014-2022 (USD Million)
Table 91 Others: NDT Market Size, By Method, 2014-2022 (USD Million)
Table 92 Brand Analysis of Top Players in NDT Market
Table 93 New Product Launches, 2014-2016
Table 94 Acquisitions, Partnerships, and Agreements, 2014�2016
Table 95 Contracts, 2014-2016
Table 96 Expansions, 2014-2015
List of Figures (81 Figures)
Figure 1 Markets Covered: Non-Destructive Testing Market
Figure 2 Report Flow
Figure 3 NDT Market: Research Design
Figure 4 Breakdown of Primary Interviews: By Company Type, Designation, and Region
Figure 5 Global Investments in Renewable Energy, 2009-2015
Figure 6 Global Investments in Renewable Energy Sector, 2015 (USD Billion)
Figure 7 Total Growth in Aircraft Fleet Size, 2015-2035
Figure 8 Market Size Estimation Methodology: Bottom-Up Approach
Figure 9 Market Size Estimation Methodology: Top-Down Approach
Figure 10 Data Triangulation Methodology
Figure 11 NDT Market, By End-User, 2016 & 2022 (USD Million)
Figure 12 BRICS to Lead NDT Market From 2014 to 2022 (USD Million)
Figure 13 BRICS to Record Highest CAGR During Forecast Period
Figure 14 India, A Lucrative Market to Invest During Forecast Period
Figure 15 New Product Launches Key Growth Strategy Adopted By Market Players From 2014 to 2016
Figure 16 Increasing Demand From Oil & Gas Industry to Fuel NDT Market Growth, From 2016 to 2022
Figure 17 Oil & Gas Industry to Lead Global NDT Market, By End-User, During Forecast Period
Figure 18 Surface Examination to Lead Global NDT Market, By Technique, By 2022
Figure 19 BRICS to Lead Global NDT Market, By Value, By 2022
Figure 20 BRICS NDT Market, By Technique, 2016 & 2022 (USD Billion)
Figure 21 BRICS NDT Market, By End-User, 2016 & 2020
Figure 22 BRICS NDT Market to Witness Significant Growth During Forecast Period
Figure 23 NDT Market: Technological Evolution
Figure 24 NDT Market, By Method
Figure 25 NDT Market, By Technique
Figure 26 NDT Market, By Application
Figure 27 NDT Market, By Component
Figure 28 NDT Market, By End-User
Figure 29 Stringent Government Regulations and Increased Demand for NDT Techniques Driving the Growth of NDT Market
Figure 30 Aging Infrastructure: Relationship Between Maintenance, Condition, and Time
Figure 31 U.S.: Expenditure to Upgrade Existing Infrastructure (USD Billion)
Figure 32 U.S.: Number of Pipeline Damage Incidents, 2006-2015
Figure 33 Age Profile of Professionals in European NDT Industry, By Country (2010)
Figure 34 Costs Involved in Degree of Automation
Figure 35 New Nuclear Reactors Connected to the Grid Globally, 2006-2015
Figure 36 Upcoming Nuclear Reactors, By Country (2016-2026)
Figure 37 Worldwide Infrastructure Expenditure Across Major Sectors, By Region, 2010-2025 (USD Trillion)
Figure 38 Emerging Technology Trends in NDT Market
Figure 39 Visual Inspection Method Segment Led NDT Market, By Method, in 2016
Figure 40 BRICS to Lead Visual Inspection Method Segment of NDT Market From 2016 to 2022 (USD Million)
Figure 41 BRICS to Lead MPT Method Segment of NDT Market From 2016 to 2022, (USD Million)
Figure 42 BRICS to Lead LPT Method Segment of NDT Market, By 2022 (USD Million)
Figure 43 Long Range Ultrasonic Inspection Program
Figure 44 BRICS to Lead Ultrasonic Testing Method Segment of NDT Market, From 2016 to 2022
Figure 45 BRICS to Lead Radiography Testing Method Segment of NDT Market From 2016 to 2022 (USD Million)
Figure 46 BRICS to Lead ECT Method Segment of NDT Market, By 2022 (USD Million)
Figure 47 Surface Examination Technique Segment to Lead NDT Market, By Technique, From 2016 to 2022 (USD Million)
Figure 48 G7 Nations to Lead Surface Examination Technique Segment of NDT Market, From 2016 to 2022 (USD Million)
Figure 49 BRICS to Lead Volumetric Examination Technique Segment of NDT Market From 2016 to 2022 (USD Million)
Figure 50 BRICS to Lead Condition Monitoring Technique Segment of NDT Market From 2016 to 2022 (USD Million)
Figure 51 G7 Nations to Lead Integrity Examination Technique Segment of NDT Market From 2016 to 2022 (USD Million)
Figure 52 Oil & Gas Industry Dominated NDT Market in 2016
Figure 53 BRICS to Lead Global NDT Market for Aerospace & Defense Industry From 2016 to 2022 (USD Million)
Figure 54 G7 Nations to Lead Global NDT Market for Automotive Industry, From 2016 to 2022 (USD Million)
Figure 55 BRICS to Lead Global NDT Market for Oil & Gas Industry, From 2016 to 2022 (USD Million)
Figure 56 BRICS to Lead Global NDT Market for Infrastructure By 2022 (USD Million)
Figure 57 BRICS to Lead Global NDT Market for Power Generation Industry, From 2016 to 2022 (USD Million)
Figure 58 G7 Nations to Lead Global NDT Market for Others, By 2022 (USD Million)
Figure 59 G7 Nations: Market Share, Country-Wise (2016)
Figure 60 G7 Nations NDT Market Witnessed Significant Growth in 2016, Owing to Contributions By Japan and Canada
Figure 61 G7 Nations NDT Market Snapshot:2016
Figure 62 BRICS NDT Market Snapshot: 2016
Figure 63 RoW NDT Market Snapshot: 2016
Figure 64 Companies Adopted Contracts & New Product Launches as Key Growth Strategies From 2014 to 2016
Figure 65 NDT Market Share Analysis, By Key Player, 2015
Figure 66 Number of Patent Applications Filed By Olympus Corporation in Japan
Figure 67 Number of Patent Applications Filed By Olympus Corporation Overseas
Figure 68 Strategic Benchmarking in NDT Market, 2014-2016
Figure 69 New Product Launches: Key Growth Strategy From 2014 to 2016
Figure 70 Regional Revenue Mix of Top Five Market Players, 2015
Figure 71 Financial Highlights of Major Players in NDT Market, 2016
Figure 72 Olympus Corporation: Company Snapshot
Figure 73 Olympus Corporation: SWOT Analysis
Figure 74 Mistras Group, Inc.: Company Snapshot
Figure 75 Mistras Group, Inc.: SWOT Analysis
Figure 76 Intertek Group PLC: Company Snapshot
Figure 77 Intertek Group PLC: SWOT Analysis
Figure 78 SGS SA: Company Snapshot
Figure 79 SGS SA: SWOT Analysis
Figure 80 GE Measurement & Control: Company Snapshot
Figure 81 GE Measurement & Control: SWOT Analysis


Growth opportunities and latent adjacency in Non-Destructive Testing (NDT) Market