Rubber Processing Chemicals Market by Type (Antidegradants, Accelerators, and Others), by Application (Tire and Non-Tire), and by Region (North America, Europe, Asia-Pacific, and Row) - Global Trends and Forecasts to 2020


The global rubber processing chemicals market is expected to grow at a CAGR of 5.4% between 2015 and 2020, to reach USD 4.8 billion 2020. The global market is expected to reach 1792.3 KT in 2020. The increasing demand for efficient and high quality products that can be used in automobile industry will boost the demand of rubber processing chemicals between 2015 and 2020.
The market has been analyzed in terms of revenue (USD) and volume (Kilotons) for all major regions, namely North America, Asia-Pacific, Europe, and RoW. The market has been further categorized on the basis of major countries in respective regions. Rubber processing chemicals applications that have been identified and covered in the report are tire and non-tire. The market has also been segmented in terms of types which are antidegradants, accelerators, and others.
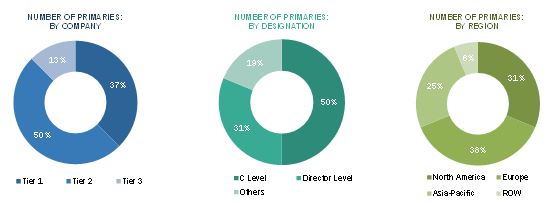
Various secondary sources such as encyclopedia, directories, technical handbooks, company annual reports, industry association publications, chemical magazine articles, world economic outlook, trade websites, and databases have been referred to identify and collect information useful for this extensive commercial study of the rubber processing chemicals market. The primary sources - experts from related industries and suppliers � have been interviewed to obtain and verify critical information as well as to assess the future prospects and market estimations.
Rubber processing chemicals enhance the properties of rubber to be used in manufacture of tires.The demand for rubber processing chemicals is expected to increase at rapid pace in Asia-Pacific region. The growing population with the increasing purchasing power of the consumers has boosted the demand for autombiles. Therefore, the growing automobile industry acts as a driver for market.
![]()
Want to explore hidden markets that can drive new revenue in Rubber Processing Chemicals Market?

On the basis of region:
- North America
- Asia-Pacific
- Europe
- RoW
On the basis applications:
- Tire
- Non-Tire
On the basis of type:
- Antidegradants
- Accelerators
- Others
The various customizations available for this report are:
Product Analysis
- Product Matrix that gives a detailed comparison of product portfolio of each company
Regional Analysis
- Further breakdown of a region with respect to a particular country
Company Information
- Detailed analysis and profiling of additional market players (up to five)
The rubber processing chemicals market is estimated to have accounted for 3.5 Billion in 2014 and is projected to reach 4.8 Billion by 2020, registering a CAGR of 5.4% between 2015 and 2020. The market is mainly driven by the growth in the automobile industry. Asia-Pacific is the fastest-growing vehicle market around the globe. The growing population coupled with the increased spending on automobiles has driven the market for rubber processing chemicals. . Asia-Pacific is thus expected to maintain its dominance in the global market owing to the steady growth in China and India. Europe is the other major market for rubber processing chemicals. This is due to the growing automobile market in Germany.
In terms of applications, The tire segment accounts for a major share due to the increased need for high-quality rubber from the automotive industry. Europe is the second-largest market for rubber processing chemicals. The automotive industry in Europe is among the largest contributors to the economy of the European Union. Due to increased demand for high-tech and sophisticated rubber products, the demand for rubber processing chemicals is estimated to rise.
Below is the graph representing rubber processing chemicals market by application.
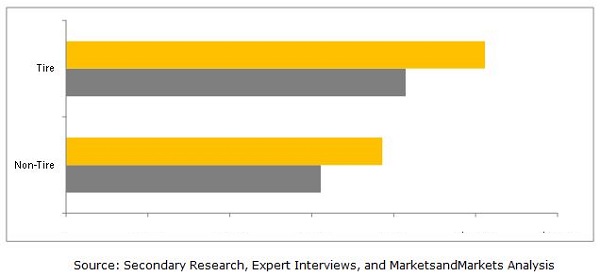
Antidegradants market hold the maximum market share, in terms of types. The demand for antidegradant is fuelled by its expansion in its applications such as tires and industrial rubber products. Moreover, the increasing demand for high performance rubber is expected to increase the demand for antidegradants.
The strigent environment regulations will be the restraining factor for the growth of market. Manufacturers of rubber processing chemicals view green tires as a promising new market, but it is hampered by several regulating guidelines issued by different governing bodies.
The key players in market are Lanxess AG (Germany), Solvay SA (Belgium), Akzonobel N.V. (Netherlands), Arkema SA (France), and BASF SE (Germany). The leading players mainly concentrate on new product launches and expansions to enhance their market reach and make innovative products available to a large number of customers.
The report covers the Asia-Pacific, North America, Europe and RoW market. It also provides a detailed segmentation of the market on the basis of type and by application, along with projections till 2020.
Table of Content
1 Introduction (Page No. - 14)
1.1 Objectives of the Study
1.2 Market Definition
1.3 Scope of the Study
1.3.1 Markets Covered
1.3.2 Years Considered in the Report
1.4 Currency
1.5 Package Size
1.6 Limitations
1.7 Stake Holders
2 Research Methodology (Page No. - 18)
2.1 Research Data
2.1.1 Secondary Data
2.1.1.1 Key Data From Secondary Sources
2.1.2 Primary Data
2.1.2.1 Key Data From Primary Sources
2.1.2.2 Key Industry Insights
2.1.2.3 Breakdown of Primary Interviews
2.2 Market Size Estimation
2.2.1 Bottom-Up Approach
2.2.2 Top-Down Approach
2.3 Market Breakdown and Data Triangulation
2.4 Research Assumptions
2.4.1 Assumptions
3 Executive Summary (Page No. - 26)
4 Premium Insights (Page No. - 31)
4.1 Significant Opportunities for Rubber Processing Chemicals
4.2 Market
4.3 Market in Asia-Pacific
4.4 Market Attractiveness
4.5 Market, By Application
4.6 Market: Developed vs Developing Nations
4.7 Lifecycle Analysis, By Region, 2014
5 Market Overview (Page No. - 38)
5.1 Introduction
5.2 Market Segmentation
5.2.1 By Region
5.3 Market Dynamics
5.3.1 Drivers
5.3.1.1 Growing Automotive Industry
5.3.1.2 Increasing Demand From Non-Tire Rubber Applications
5.3.2 Restraints
5.3.2.1 Stringent Environmental Regulations
5.3.3 Opportunities
5.3.3.1 Rapidly Increasing Demand From the Asia-Pacific Region
5.3.3.2 Emergence of High-Performance Rubbers
5.4 Value-Chain Analysis
5.5 Porter�s Five Forces Analysis
5.5.1 Threat of New Entrants
5.5.2 Threat of Substitutes
5.5.3 Bargaining Power of Suppliers
5.5.4 Bargaining Power of Buyers
5.5.5 Intensity of Competitive Rivalry
5.6 Policy and Regulations
5.6.1 Reach
5.6.2 EPA
6 Market, By Type (Page No. - 48)
6.1 Introduction
6.2 Market Size and Projection
6.2.1 Antidegradants
6.2.2 Accelerators
6.2.3 Others
7 Market, By Application (Page No. - 55)
7.1 Introduction
7.2 Tire
7.3 Non-Tire
8 Market, By Region (Page No. - 61)
8.1 Introduction
8.2 Asia-Pacific
8.2.1 China
8.2.2 India
8.2.3 Japan
8.2.4 Rest of Asia-Pacific
8.3 Europe
8.3.1 Germany
8.3.2 France
8.3.3 Italy
8.3.4 U.K.
8.3.5 Rest of Europe
8.4 North America
8.4.1 U.S.
8.4.2 Canada
8.4.3 Mexico
8.5 RoW
8.5.1 Middle East & Africa
8.5.2 Latin America
9 Competitive Landscape (Page No. - 92)
9.1 Overview
9.2 Expansions: the Most Adopted Growth Strategy
9.3 Maximum Developments in 2013
9.4 Solvay SA, Lanxess AG, and BASF SE: Most Active Participants
9.5 Competitive Situation and Trends
9.5.1 Expansions
9.5.2 New Product Launches
9.5.3 Mergers & Acquisitions
9.5.4 Research & Development
10 Company Profiles (Page No. - 99)
10.1 Regional Revenue Mix of Market Players
10.2 BASF SE
10.2.1 Business Overview
10.2.2 Products
10.2.3 Recent Developments
10.2.4 BASF SE: Swot Analysis
10.2.5 MnM View
10.3 Akzonobel N.V.
10.3.1 Business Overview
10.3.2 Products
10.3.3 Akzonobel N.V.: Swot Analysis
10.3.4 MnM View
10.4 Lanxess AG
10.4.1 Business Overview
10.4.2 Products
10.4.3 Recent Developments
10.4.4 Laxness AG: Swot Analysis
10.4.5 MnM View
10.5 Solvay SA
10.5.1 Business Overview
10.5.2 Products
10.5.3 Recent Developments
10.5.4 Solvay SA: Swot Analysis
10.5.5 MnM View
10.6 Arkema SA
10.6.1 Business Overview
10.6.2 Products
10.6.3 Recent Developments
10.6.4 Arkema SA: Swot Analysis
10.6.5 MnM View
10.7 China Petroleum & Chemical Corporation (Sinopec Corp.)
10.7.1 Business Overview
10.7.2 Products
10.8 Eastman Chemical Company
10.8.1 Business Overview
10.8.2 Products
10.8.3 Recent Developments
10.9 R. T. Vanderbilt Company, Inc
10.9.1 Business Overview
10.9.2 Products
10.10 Emery Oleochemicals Llc
10.10.1 Business Overview
10.10.2 Products
10.10.3 Recent Developments
10.11 Behn Meyer Group
10.11.1 Business Overview
10.11.2 Products
10.11.3 Recent Developments
11 Appendix (Page No. - 116)
11.1 Excerpts From Industry Experts
11.2 Discussion Guide
11.3 Introducing Rt: Real Time Market Intelligence
11.4 Available Customizations
11.5 Related Reports
List of Tables (76 Tables)
Table 1 Rubber Processing Chemicals Market Size, By Type, 2013�2020 (Kiloton)
Table 2 Market Size, By Type, 2013�2020 (USD Million)
Table 3 Antidegradants Market Size, By Region, 2013�2020 (Kiloton)
Table 4 Antidegradants Market Size, By Region, 2013�2020 (USD Million)
Table 5 Accelerators Market Size, By Region, 2013�2020 (Kiloton)
Table 6 Accelerators Market Size, By Region, 2013�2020 (USD Million)
Table 7 Others Market Size, By Region, 2013�2020 (Kiloton)
Table 8 Others Market Size, By Region, 2013�2020 (USD Million)
Table 9 Market Size, By Application, 2013�2020 (Kiloton)
Table 10 Market Size, By Application, 2013�2020 (USD Million)
Table 11 Market Size In Tire, By Region, 2013�2020 (Kiloton)
Table 12 Market Size In Tire, By Region, 2013�2020 (USD Million)
Table 13 Market Size In Non-Tire, By Region, 2013-2020 (Kiloton)
Table 14 Market Size In Non-Tire, By Region, 2013-2020 (USD Million)
Table 15 Market Size, By Region, 2013�2020 (Kiloton)
Table 16 Market Size, By Region, 2013�2020 (USD Million)
Table 17 Market Size, By Type, 2013�2020 (Kiloton)
Table 18 Market Size, By Type, 2013�2020 (USD Million)
Table 19 Market Size, By Application, 2013�2020 (Kiloton)
Table 20 Market Size, By Application, 2013�2020 (USD Million)
Table 21 Asia-Pacific: Rubber Processing Chemicals Market Size, By Country, 2013�2020 (Kiloton)
Table 22 Asia-Pacific: Market Size, By Country, 2013�2020 (USD Million)
Table 23 Asia-Pacific: Market Size, By Type, 2013�2020 (Kiloton)
Table 24 Asia-Pacific: Market Size, By Type, 2013�2020 (USD Million)
Table 25 Asia-Pacific: Market Size, By Application, 2013�2020 (Kiloton)
Table 26 Asia-Pacific: Market Size, By Application, 2013�2020 (USD Million)
Table 27 China: Rubber Processing Chemicals Market Size, By Application, 2013�2020 (Kiloton)
Table 28 China: Market Size, By Application, 2013�2020 (USD Million)
Table 29 India: Rubber Processing Chemicals Market Size, By Application, 2013�2020 (Kiloton)
Table 30 India: Market Size, By Application, 2013�2020 (USD Million)
Table 31 Japan: Rubber Processing Chemicals Market Size, By Application, 2013�2020 (Kiloton)
Table 32 Japan: Market Size, By Application, 2013�2020 (USD Million)
Table 33 Rest Of Asia-Pacific: Rubber Processing Chemicals Market Size, By Application, 2013�2020 (Kiloton)
Table 34 Rest Of Asia-Pacific: Market Size, By Application, 2013�2020 (USD Million)
Table 35 Europe: Rubber Processing Chemicals Market Size, By Country, 2013�2020 (Kiloton)
Table 36 Europe: Market Size, By Country, 2013�2020 (USD Million)
Table 37 Europe: Market Size, By Type, 2013�2020 (Kiloton)
Table 38 Europe: Market Size, By Type, 2013�2020 (USD Million)
Table 39 Europe: Market Size, By Application, 2013�2020 (Kiloton)
Table 40 Europe: Market Size, By Application, 2013�2020 (USD Million)
Table 41 Germany: Rubber Processing Chemicals Market Size, By Application, 2013�2020 (Kiloton)
Table 42 Germany: Market Size, By Application, 2013�2020 (USD Million)
Table 43 France: Rubber Processing Chemicals Market Size, By Application, 2013�2020 (Kiloton)
Table 44 France: Market Size, By Application, 2013�2020 (USD Million)
Table 45 Italy: Rubber Processing Chemicals Market Size, By Application, 2013�2020 (Kiloton)
Table 46 Italy: Market Size, By Application, 2013�2020 (USD Million)
Table 47 U.K.: Rubber Processing Chemicals Market Size, By Application, 2013�2020 (Kiloton)
Table 48 U.K.: Market Size, By Application, 2013�2020 (USD Million)
Table 49 Rest Of Europe: Rubber Processing Chemicals Market Size, By Application, 2013�2020 (Kiloton)
Table 50 Rest Of Europe: Market Size, By Application, 2013�2020 (USD Million)
Table 51 North America: Rubber Processing Chemicals Market Size, By Country, 2013�2020 (Kiloton)
Table 52 North America: Market Size, By Country, 2013�2020 (USD Million)
Table 53 North America: Market Size, By Type, 2013�2020 (Kiloton)
Table 54 North America: Market Size, By Type, 2013�2020 (USD Million)
Table 55 North America: Market Size, By Application, 2013�2020 (Kiloton)
Table 56 North America: Market Size, By Application, 2013�2020 (USD Million)
Table 57 U.S.: Rubber Processing Chemicals Market Size, By Application, 2013-2020 (Kiloton)
Table 58 U.S.: Market Size, By Application, 2013-2020 (USD Million)
Table 59 Canada: Rubber Processing Chemicals Market Size, By Application, 2013�2020 (Kiloton)
Table 60 Canada: Market Size, By Application, 2013�2020 (USD Million)
Table 61 Mexico: Rubber Processing Chemicals Market Size, By Application, 2013-2020 (Kiloton)
Table 62 Mexico: Market Size, By Application, 2013�2020 (USD Million)
Table 63 RoW: Rubber Processing Chemicals Market Size, By Country, 2013�2020 (Kiloton)
Table 64 RoW: Market Size, By Country, 2013�2020 (USD Million)
Table 65 RoW: Market Size, By Type, 2013�2020 (Kiloton)
Table 66 RoW: Market Size, By Type, 2013�2020 (USD Million)
Table 67 RoW: Market Size, By Application, 2013�2020 (Kiloton)
Table 68 RoW: Market Size, By Application, 2013�2020 (USD Million)
Table 69 Middle East & Africa: Rubber Processing Chemicals Market Size, By Application, 2013�2020 (Kiloton)
Table 70 Middle East & Africa: Market Size, By Application, 2013�2020 (USD Million)
Table 71 Latin America: Rubber Processing Chemicals Market Size, By Application, 2013�2020 (Kiloton)
Table 72 Latin America: Market Size, By Application, 2013�2020 (USD Million)
Table 73 Expansions, 2011�2015
Table 74 New Product Launches, 2011�2015
Table 75 Mergers & Acquisitions, 2011�2015
Table 76 Research & Development, 2011�2015
List of Figures (42 Figures)
Figure 1 Rubber Processing Chemicals Market, Research Design
Figure 2 Market Size Estimation: Bottom-Up Approach
Figure 3 Market Size Estimation: Top-Down Approach
Figure 4 Market: Data Triangulation
Figure 5 Antidegradants to Dominate the Market Between 2015
Figure 6 Non-Tire Segment to Register the Highest CAGR Between 2015
Figure 7 Asia-Pacific to Witness the Fastest Growth Rate During the Forecast Period
Figure 8 Asia-Pacific is Estimated to Be the Largest Market
Figure 9 Market to Witness Rapid Growth Between 2015
Figure 10 Asia-Pacific to Grow at the Highest Rate Between 2015
Figure 11 China Accounted for the Largest Share in the Asia-Pacific Region in 2014
Figure 12 Asia Pacific to Dominated Non Tire Segment Betweeen 2015
Figure 13 The Tire Segment Dominated the Market in 2014
Figure 14 China to Emerge as A Lucrative Market Between 2015
Figure 15 Asia-Pacific Market to Register High Growth During the Forecast Period
Figure 16 Market, By Region
Figure 17 Driver, Restraints and Opportunity for Market
Figure 18 Raw Material Accounts for the Major Value Addition
Figure 19 Porter�s Five Forces Analysis
Figure 20 Antidegradants to Grow at Rapid Pace
Figure 21 Antidegradants to Dominate the Market Between 2015
Figure 22 Asia-Pacific to Register the Highest Growth Rate for Accelerators Between 2015
Figure 23 Non-Tire to Witness High Growth During the Projected Period
Figure 24 Asia-Pacific to Drive the Tire Market Between 2015
Figure 25 Rising Demand From the Developing Nations to Drive the Market for Non-Tire Between 2015
Figure 26 Regional Snapshot: China and India are Emerging as Strategic Locations
Figure 27 China and India to Be the Fastest-Growing Markets for Rubber Processing Chemicals Between 2015
Figure 28 Asia-Pacific Market Snapshot: China to Continue Dominating the Market
Figure 29 European Market Snapshot: Tire to Dominate the Market
Figure 30 North American Market Snapshot: U.S. to Register High Growth
Figure 31 Middle East & Africa to Register the Highest CAGR Between 2015
Figure 32 Expansions as the Key Growth Strategy, Between 2011
Figure 33 Maximum Developments in 2013
Figure 34 European: Market Witnessing Maximum Number of Developments, Between 2011
Figure 35 Solvay SA is the Most Active Company in Terms of Developments Between 2011
Figure 36 BASF SE: Company Snapshot
Figure 37 Akzonobel N.V.: Company Snapshot
Figure 38 Lanxess AG: Company Snapshot
Figure 39 Solvay SA: Company Snapshot
Figure 40 Arkema SA: Company Snapshot
Figure 41 Sinopec Corp.: Company Snapshot
Figure 42 Eastman Chemical Company: Company Snapshot


Growth opportunities and latent adjacency in Rubber Processing Chemicals Market