Food and Beverage Metal Cans Market

Report Code FB 2722
Published in Jan, 2025, By MarketsandMarkets™
Download PDF

Choose License Type

Buy Report Now Inquire Before Buying

Food and Beverage Metal Cans Market by Fabrication Type (Two Pieces, Three Pieces), Material Type (Aluminum, Steel), Degree of Internal Pressure (Vacuum Cans, Pressurized Cans), Coating Type (White Base Cans, Bright Coating Cans), Application (Food, Beverage), Beverage Can Capacity (100 Ml, 250 Ml, 200 Ml, 310 Ml, 330 Ml), And Region – Global Forecast to 2029


Overview

The food and beverage metal cans market is estimated at USD 50.42 billion in 2024 and is projected to reach USD 70.72 billion by 2029, at a CAGR of 7.0% from 2024 to 2029.

Metal cans are widely used for packaging various food and beverage products because they maintain quality in terms of appearance, texture, flavor, and nutritional value, while also ensuring food safety. These aspects drive ongoing innovations in the metal can market, where manufacturers prioritize food safety. However, growth is constrained by strict regulations on materials like aluminum and steel, as well as inadequate infrastructure in emerging countries.

As consumer preferences shift toward healthier and more natural products, there is a noticeable trend toward packaging innovations that align with these desires. The rising demand for ready-to-drink beverages, plant-based foods, and premium food products is contributing to the increased adoption of metal can packaging. This trend is attributed to the superior ability of metal cans to preserve flavor, nutrients, and freshness. Additionally, metal cans provide a barrier against light and air, which helps maintain the quality and integrity of health-focused products throughout their shelf life. Consequently, metal cans are becoming a preferred choice for brands striving to meet evolving consumer demands and ensure product excellence.

Global food and beverage brands seek premium packaging to differentiate their products. This includes the use of high-quality materials, as well as unique shapes, colors, and decorations. Advanced printing techniques such as metallic foils, high-gloss finishes, and embossing are also becoming popular. Furthermore, interactive packaging that incorporates QR codes is gaining traction, allowing consumers to scan with their smartphones for detailed information regarding ingredients, product origin, recycling, and expiration dates.

Food and Beverage Metal Cans Market

Attractive Opportunities in the Food and Beverage Metal Cans Market

APAC

The market growth in APAC Region can be attributed to the rising population, rising income, increasing urbanization, and rising awareness for sustainability in  the region.

The rise in demand for sustainable practices has driven the demand for metal cans as packaging materials. Hence, manufacturers have adopted aluminum packaging at high rates.

The growing population and and need for on-the-go food and beverages in the APAC region are driving the demand for food and beverage metal cans. The growing awareness among consumers about harmful effects of plastic is the other factor driving demand.

The market growth in APAC can be attributed to the rising demand for safe food packaging in the region. 

Expansions, joint ventures, and product launches would offer lucrative opportunities for market players over the next few years.

Global Food and Beverage Metal Cans Market Dynamics

Drivers: Companies are shifting to lightweight, durable food & beverage cans, fueling growth in the food & beverage metal can market

In the food and beverage industry, companies are increasingly adopting lightweight and durable metal cans, leading to significant growth in the metal can market. This trend is driven by a demand for packaging solutions that provide sustainability, protection, and ease of transportation, all while minimizing environmental impact. Lightweight cans are particularly beneficial as they help reduce transportation costs and carbon emissions, which is crucial for companies striving to meet strict environmental goals. Their durability ensures that products remain intact and protected, which is essential for maintaining quality and extending shelf life, especially for beverages and perishable foods.

Additionally, consumers are becoming more aware of sustainable packaging, prompting manufacturers to focus on metal cans, which are recyclable and maintain their structural integrity across multiple recycling cycles. Consequently, innovations in the metal can industry—such as thinner walls without compromising strength and advances in coating technologies—are enabling companies to provide superior packaging solutions that meet both regulatory standards and consumer expectations.

A notable example of this shift is Toyo Seikan, which announced in April 2024 the development of the lightest aluminum double-integrated (DI) can in Japan using Compression Bottom Reform (CBR) technology. This innovation reduces the weight of their 350ml and 500ml cans by up to 2.0 grams, leading to approximately a 9% reduction in greenhouse gas emissions. Similarly, Ball Corporation, in partnership with CavinKare, introduced sustainable retort aluminum cans for milkshakes in April 2024. These two-piece cans are designed for the dairy sector in India and offer reduced transportation costs and improved product freshness, aligning with the growing demand for ready-to-drink beverages and sustainable packaging solutions.

Restraints: Move toward alternative packaging options

The metal cans market faces increasing competition from alternative packaging options like Tetrapaks, pouches, and blister packaging. These alternatives are often cheaper, more convenient, and increasingly preferred by food and beverage companies for their innovative features. Pouch and blister packaging offer several advantages, including reduced material costs compared to traditional rigid packaging and enhanced sustainability. Consequently, many fast-moving consumer goods (FMCG) companies are adopting pouch packaging to offer greater convenience to consumers. Additionally, new designs with easy-open and easy-reclose features are being developed across various market segments. However, the rising cost of final packaging could impact sales. This dual challenge pressures companies to find a balanced approach that integrates both sustainability and cost management.


Opportunities: Driving Innovation in Metal Can Packaging: Sustainable Printing and Coating Solutions

With increasing consumer focus on health and sustainability, innovations in metal can packaging are meeting demands for safer, eco-friendly options. BPA-free coatings have become a key selling point, offering non-toxic solutions in response to stricter regulations. Meanwhile, advancements in printing technologies, such as digital printing and high-definition imaging, enable vibrant, customizable designs that reduce waste and enhance brand identity. For example, DataLase's inkless technology, introduced in June 2024, uses specialty pigments that change color with laser wavelengths, eliminating the need for ink and labels. This solution improves recyclability and supports sustainability, while also meeting traceability requirements like Digital Product Passports.

Similarly, Ball Corporation’s Eyeris technology, launched in September 2023, delivers photo-realistic imagery on aluminum cans. This printing method spans 360 degrees and utilizes advanced techniques to offer vivid, high-resolution designs that resonate with consumers, with 76% viewing packaging as a key purchase factor. Eyeris also upholds sustainability with aluminum's recyclability. Both innovations from DataLase and Ball Corporation demonstrate the growing trend of combining sustainable packaging with cutting-edge printing and coating technologies. These developments not only address environmental concerns but also enhance consumer engagement, positioning the metal can industry for growth in the face of evolving regulations and market demands.

Challenges: High usage of plastic packaging due to lower cost 

Awareness of the benefits of metal packaging for food and beverages is limited in developing countries. Additionally, the high cost of raw materials like steel and aluminum discourages consumers from choosing canned products. A significant challenge for metal can manufacturers is the increasing use of polyethylene terephthalate (PET) bottles, particularly for beverages. Other sustainable packaging materials, such as paper, glass, and plastic, are more cost-effective than metal. Alternatives to metal cans, including Tetra Pak cartons, glass bottles, PET, and flexible pouches, as well as other innovative packaging methods, are also gaining popularity. The growing use of these packaging options is hindering the expansion of the metal cans market. According to the British Plastics Federation (BPF) in 2020, 1.1 million tons of plastic packaging are recycled annually, with the UK recycling up to 39% of its plastic packaging each year.

Global Food and Beverage Metal Cans Market Ecosystem Analysis

The food and beverage metal cans market is driven by demand from food and beverage companies seeking durable, sustainable packaging solutions. Manufacturers produce cans using materials like aluminum and steel, focusing on recyclability and innovation to meet industry standards. Regulatory bodies ensure compliance with safety, quality, and environmental guidelines, while end users, including major beverage and food producers, adopt metal cans for their sustainability benefits. The ecosystem thrives on the growing demand for eco-friendly packaging and the collaboration between manufacturers, regulators, and end users.

The ecosystem analysis of the food and beverage metal cans industry highlights the interconnected roles of various stakeholders. Demand-side companies, including Coca-Cola, PepsiCo, and Nestlé, drive the need for packaging solutions. Manufacturers like Ball Corporation, Crown, and Ardagh Group supply the metal cans, ensuring quality and scalability. Regulatory bodies such as FSSAI, ISO, and Aluminum Association maintain safety and environmental and industry standards. End users like Heineken and AB InBev use these cans to package their beverages, aligning with sustainability and market trends. This ecosystem reflects a collaborative effort between demand, production, regulation, and consumption.

Top Companies in Food and Beverage Metal Cans Market
 

The beverage segment is estimated to account for the largest market share of the food and beverage metal cans market based on application.

Aluminum cans are widely used to package beverages like soda, beer, and wine. In contrast, metal cans are commonly employed for packaging food items such as vegetables, soups, fruits, pet food, and meats. Beverage cans are highly valued for their portability and convenience, making them ideal for active lifestyles—hiking, camping, and other outdoor activities—due to their lightweight, durable nature that resists breakage. They are especially suitable for outdoor locations where glass bottles are prohibited, such as stadiums, concerts, and athletic events, allowing consumers to enjoy their favorite drinks anytime, anywhere.

In 2023, sustainability became a key concern for beverage brands, and this trend is set to continue in 2024. As consumers become more conscious of the environmental impact of their choices and as government regulations tighten globally, sustainability is becoming increasingly important. The European Parliament, for instance, proposed a comprehensive directive on new regulations for green claims and environmental labeling schemes. This new initiative is expected to significantly impact brands and businesses operating in the region, positively affecting the beverage industry’s aluminum and steel cans use.

Based on type, 2-piece metal cans are anticipated to have the highest growth rate in the food and beverage metal cans market.

Two-piece cans come in three main types: draw (shallow draw), where the height is less than the diameter; draw and redraw (DRD); and draw and iron (D&I). These cans have two parts: a body integrated with the bottom lid and a separate lid with an opening. Double seaming attaches the can body to the lids to protect the contents from external contamination. Steel and aluminum are the primary raw materials used in manufacturing these cans, making them ideal for packaging carbonated and non-carbonated beverages like beer, wine, sports drinks, and fruit juices. Two-piece cans offer several advantages over three-piece ones, such as a seamless connection between the body and bottom, allowing for a tighter seal and reduced raw material consumption.

The 2-piece cans segment in the food and beverage metal cans market has grown substantially, fueled by the rising demand for carbonated beverages like soda, energy drinks, and beer. These cans provide a lightweight, cost-effective packaging solution, making them ideal for easy transportation and handling.

The APAC market is projected to grow the fastest in the food and beverage metal cans processing market.

During the forecast period, the Asia Pacific region has been a key growth driver in the global metal cans market for food and beverages. Countries like China and India have significantly contributed to this growth, given their high population density and status as leading producers of fruits and vegetables. These factors are expected to increase the demand for processed food and beverages in the region, making Asia Pacific an emerging market for metal cans in the food and beverage sector. The study considers countries such as China, India, Japan, Thailand, Indonesia, Australia, and New Zealand, where market growth is anticipated to be substantial.

Various packaging types are popular in the region, including flexible, rigid plastic, paper, glass, and metal packaging. The growing population has increased demand from the food and beverage industry. In response, global players like Ball Corporation (US) and Crown Holdings Inc. (US) are expanding into the Asia Pacific market by establishing new manufacturing plants, further boosting the metal cans market for food and beverages.

HIGHEST CAGR MARKET IN 2024-2029
CHINA FASTEST GROWING MARKET IN THE REGION
Food and Beverage Metal Cans Market Size and Share

Recent Developments of Food and Beverage Metal Cans Market

  • In July 2024, Silgan Holding Inc. Acquired Weener Packaging. Silgan Holdings Inc. announced today that it has entered into a sale and purchase agreement to acquire Weener Plastics Holdings B.V., a leading manufacturer of specialized dispensing solutions for personal care, food, and healthcare products, for an enterprise value of USD 923 million.
  • In August 2023, Crown's Holdings, Inc. acquired the Saarlouis facility to strengthen its European beverage can operations in Germany, adding around one billion units of annual production capacity. Upon closing, Crown will also take over Helvetia's existing customer base and associated contracts as part of the agreement.
  • In October 2022, Ball Corporation expanded its portfolio and range of infinitely recyclable Ball Aluminum Cups by adding new 9-ounce and 12-ounce options. This met the rising demand for eco-friendly beverage cups while solidifying its leadership in sustainable packaging.
  • In May 2022, Ball Corporation partnered with Coldplay's Music of the Spheres Tour to supply infinitely recyclable Ball Aluminum Cups. The goal was to reduce waste and enhance refill and recycling efforts. This collaboration supported Ball Corporation's market growth by promoting its sustainable packaging solutions and broadening its customer base within the entertainment industry.
  • In April 2022, Ardagh Group acquired Consol Glass, a USD 1 billion acquisition of Consol, broadening its global footprint and strengthening its presence in the African glass packaging market. This acquisition sets the stage for future investments and addresses rising consumer demand.
  • In October 2021, Crown Holdings, Inc. launched a round-to-square tin, available in a shorter size, targeting the luxury market. This distinctive design, paired with customizable finishes, offers uniqueness and collectability. As a 100% recyclable product, it aligns with sustainability objectives, contributing to Crown's market growth.

Key Market Players

List of Top Food and Beverage Metal Cans Market Companies

The Food and Beverage Metal Cans Market is dominated by a few major players that have a wide regional presence. The major players in the Food and Beverage Metal Cans Market are

Want to explore hidden markets that can drive new revenue in Food and Beverage Metal Cans Market?

Scope of the Report

Report Attribute Details
Market size available for years 2024-2029
Base year considered 2023
Forecast period 2024–2029
Forecast units USD (Million)
Segments Covered By Application, By Degree of Internal Pressure,  By Material Type, By Fabrication Type, By Coating Type, By Beverage Can Capacity and By Region
Regions covered North America, Europe, Asia Pacific, South America and Rest of the World


Key Questions Addressed by the Report

Which region is projected to account for the largest share of the food and beverage metal cans market?
The North American region accounted for the largest share in terms of value, at USD 12.43 billion in 2024, and is expected to grow at a CAGR of 6.5% during the forecast period.
What is the current size of the global food and beverage metal cans market?
The food and beverage metal cans market is estimated at USD 50.42 billion in 2024 and is projected to reach USD 70.72 billion by 2029, at a CAGR of 7.0% from 2024 to 2029.
What are the key players in the food and beverage metal cans market?
Crown Holdings, Inc. (US), Ball Corporation (US), Silgan Holdings Inc. (US), Ardagh Group (Luxembourg), CCL Industries (US), CAN-PACK SA (Poland), Kian-Joo Group (Malaysia), CPMC Holdings (China), Envases Group (Spain), and Toyo Seikan Group Holdings, Ltd. (Japan).
What factors drive the food and beverage metal cans market?
Recyclable properties of metal cans
High nutritional value, extended shelf life, and low price of canne
Convenience factors spurring innovations in can manufacturing
Which segment by material source accounted for the largest food and beverage metal cans market share?
By material, the aluminum segment dominated the food and beverage metal cans market and was valued at USD 27.35 billion in 2024.


Personalize This Research

  • Triangulate with your Own Data
  • Get Data as per your Format and Definition
  • Gain a Deeper Dive on a Specific Application, Geography, Customer or Competitor
  • Any level of Personalization
Request A Free Customisation

Let Us Help You

  • What are the Known and Unknown Adjacencies Impacting the Food and Beverage Metal Cans Market
  • What will your New Revenue Sources be?
  • Who will be your Top Customer; what will make them switch?
  • Defend your Market Share or Win Competitors
  • Get a Scorecard for Target Partners
Customized Workshop Request

Table Of Contents

Exclusive indicates content/data unique to MarketsandMarkets and not available with any competitors.

TITLE
PAGE NO
INTRODUCTION
33
RESEARCH METHODOLOGY
38
EXECUTIVE SUMMARY
49
PREMIUM INSIGHTS
54
MARKET OVERVIEW
60
MARKET OVERVIEW
61
  • 6.1 INTRODUCTION
  • 6.2 MACROECONOMIC INDICATORS
    GLOBALLY INCREASING URBAN POPULATION
    RAW MATERIAL COST
    ENVIRONMENTAL REGULATIONS
    SUSTAINABILITY TRENDS
  • 6.3 MARKET DYNAMICS
    DRIVERS
    - Rising demand for two-piece beverage cans due to superior functionality and cost-efficiency
    - Growing inclination toward lightweight and durable metal cans
    - Retainment of nutritional value, extension of shelf life, and low prices of canned foods
    - Demand for convenience foods spurring innovations in can manufacturing
    RESTRAINTS
    - Stringent government regulations
    - Consumer shift toward alternative options for packaging
    OPPORTUNITIES
    - Growing on-the-go snacking trends and portability of metal cans
    - Increasing awareness regarding sustainable printing and coating solutions
    CHALLENGES
    - Rising trend of biodegradable packaging
    - High usage of plastic packaging due to lower cost
    - Declining aluminium can recycling rates in US
  • 6.4 IMPACT OF GEN AI ON FOOD & BEVERAGE METAL CANS MARKET
    USE OF GEN AI IN FOOD & BEVERAGE METAL CANS MARKET
INDUSTRY TRENDS
72
  • 7.1 INTRODUCTION
  • 7.2 SUPPLY CHAIN ANALYSIS
  • 7.3 VALUE CHAIN ANALYSIS
    RESEARCH AND PRODUCT DEVELOPMENT
    RAW MATERIAL SOURCING
    PRODUCTION AND PROCESSING
    DISTRIBUTION
    MARKETING AND SALES
    END USER
  • 7.4 TRADE ANALYSIS
    EXPORT SCENARIO RELATED TO HS CODE 731021-COMPLIANT PRODUCTS
    - Export scenario of metal cans related to food & beverages
    IMPORT SCENARIO RELATED TO HS CODE 731021-COMPLIANT PRODUCTS
    - Import scenario of metal cans related to food & beverages
  • 7.5 TECHNOLOGY ANALYSIS
    IOT IN PACKAGING INDUSTRY
    NANOTECHNOLOGY IN FOOD PACKAGING INDUSTRY
  • 7.6 PRICING ANALYSIS
    AVERAGE SELLING PRICE TREND OF METAL CANS OF KEY PLAYERS, BY COATING TYPE
    AVERAGE SELLING PRICE TREND, BY FABRICATION TYPE
    AVERAGE SELLING PRICE TREND, BY REGION
  • 7.7 ECOSYSTEM ANALYSIS
    DEMAND SIDE
    SUPPLY SIDE
  • 7.8 TRENDS/DISRUPTIONS IMPACTING CUSTOMER BUSINESS
  • 7.9 PATENT ANALYSIS
  • 7.10 KEY CONFERENCES & EVENTS, 2024–2025
  • 7.11 TARIFF AND REGULATORY LANDSCAPE
    REGULATORY BODIES, GOVERNMENT AGENCIES, AND OTHER ORGANIZATIONS
    FOOD & BEVERAGE METAL CANS REGULATIONS IN NORTH AMERICA
    - US
    - Canada
    FOOD & BEVERAGE METAL CANS REGULATIONS IN EUROPE
    FOOD & BEVERAGE METAL CANS REGULATIONS IN ASIA PACIFIC
    - China
    - India
  • 7.12 PORTER’S FIVE FORCES ANALYSIS
    INTENSITY OF COMPETITIVE RIVALRY
    BARGAINING POWER OF SUPPLIERS
    BARGAINING POWER OF BUYERS
    THREAT OF SUBSTITUTES
    THREAT OF NEW ENTRANTS
  • 7.13 KEY STAKEHOLDERS AND BUYING CRITERIA
    KEY STAKEHOLDERS AND BUYING PROCESS
    BUYING CRITERIA
  • 7.14 CASE STUDY ANALYSIS
    BEVERAGE CANS TO BE ESTHETICALLY APPEALING
    BALL CORPORATION: AI INTEGRATION ENHANCING EFFICIENCY
FOOD & BEVERAGE METAL CANS MARKET, BY FABRICATION TYPE
98
  • 8.1 INTRODUCTION
  • 8.2 2-PIECE
    GROWING DEMAND FOR BEVERAGES AND CONVENIENCE FOODS TO DRIVE MARKET
  • 8.3 3-PIECE
    RISING DEMAND DUE TO VERSATILITY AND ENHANCED PRODUCT PROTECTION TO BOOST MARKET
FOOD & BEVERAGE METAL CANS MARKET, BY MATERIAL TYPE
105
  • 9.1 INTRODUCTION
  • 9.2 ALUMINUM
    SUPERIOR FORMABILITY AND WORKABILITY, ALONG WITH RECYCLABILITY, TO PROPEL MARKET
    STANDARD GRADE ALUMINUM
    HIGH-STRENGTH ALUMINUM
  • 9.3 STEEL
    STRENGTH, DURABILITY, AND EXCELLENT BARRIER PROPERTIES TO BOOST MARKET
    TIN-PLATED STEEL
    TIN-FREE STEEL
FOOD & BEVERAGE METAL CANS MARKET, BY DEGREE OF INTERNAL PRESSURE
114
  • 10.1 INTRODUCTION
  • 10.2 VACUUM CANS
    PRESERVATION OF FRESHNESS AND QUALITY OF CONTENTS TO BOOST MARKET
  • 10.3 PRESSURIZED CANS
    EFFICIENT, CONTROLLED DISPENSING, ENABLING EASE OF PRODUCT USE TO PROPEL MARKET
FOOD & BEVERAGE METAL CANS MARKET, BY COATING TYPE
117
  • 11.1 INTRODUCTION
  • 11.2 WHITE BASE COATING
    ECO-FRIENDLY, COST-EFFICIENT COATINGS ENABLING DURABILITY AND ENHANCED PRINTABILITY TO DRIVE MARKET
  • 11.3 BRIGHT COATING
    ESTHETIC PRESENTATION AND ENHANCED BRAND VISIBILITY TO DRIVE MARKET
FOOD & BEVERAGE METAL CANS MARKET, BY APPLICATION
123
  • 12.1 INTRODUCTION
  • 12.2 FOOD
    FRUITS & VEGETABLES
    - Maintenance of freshness and nutritional quality to boost market
    CONVENIENCE FOODS
    - Portability due to metal cans to drive market
    PET FOOD
    - Demand for premium, high-quality food products to boost market
    MEAT & SEAFOOD
    - Preservation of quality, taste, and texture to propel market
    OTHER FOOD PRODUCTS
  • 12.3 BEVERAGES
    ALCOHOLIC BEVERAGES
    - Maintenance of taste, quality, and freshness to drive market
    CARBONATED SOFT DRINKS
    - Superior carbonation retention, preservation of fizzy texture, and enhanced taste to drive market
    SPORTS & ENERGY DRINKS
    - Protection by maintaining product integrity and quality to propel market
    OTHER BEVERAGES
FOOD & BEVERAGE METAL CANS MARKET, BY BEVERAGE CAN CAPACITY
144
  • 13.1 INTRODUCTION
  • 13.2 100 ML
    COMPACT SIZE FOR ON-THE-GO LIFESTYLES AND HEALTH-CONSCIOUS CONSUMERS TO DRIVE DEMAND
  • 13.3 150 ML
    SLEEK DESIGN, ELEGANT BRANDING, AND ENHANCED PERCEPTION OF LUXURY AND ESTHETICS TO BOOST DEMAND
  • 13.4 200 ML
    FAVORED CHOICE AMONG FAMILIES AND HEALTH-CONSCIOUS CONSUMERS TO DRIVE DEMAND
  • 13.5 310 ML
    GROWING TREND TOWARD HEALTHIER BEVERAGE OPTIONS TO PROPEL MARKET GROWTH
  • 13.6 330 ML
    VERSATILITY FOR WIDE RANGE OF BEVERAGES TO PROPEL MARKET
  • 13.7 OTHER CAN CAPACITIES
FOOD & BEVERAGE METAL CANS MARKET, BY REGION
148
  • 14.1 INTRODUCTION
  • 14.2 NORTH AMERICA
    US
    - Significant production of processed food and beverages relying on metal packaging to boost market
    CANADA
    - Regulations for sustainable packaging to create new opportunities for market players
    MEXICO
    - Boom in beer production to fuel market
  • 14.3 ASIA PACIFIC
    CHINA
    - Rising international demand for canned food to drive market
    INDIA
    - Population growth and rising disposable incomes to drive market expansion
    THAILAND
    - Booming beverage and packaged food sectors to drive market
    INDONESIA
    - Changing consumer preferences toward convenience and longer shelf-life products to boost market
    JAPAN
    - Government emphasis on flexible and eco-friendly packaging to boost market
    AUSTRALIA & NEW ZEALAND
    - Emphasis on use of recyclable materials for food & beverage packaging to drive market
    REST OF ASIA PACIFIC
  • 14.4 EUROPE
    GERMANY
    - Transition from glass and plastic packaging to metal packaging to boost market
    UK
    - Rising customer demand and exports to drive demand
    FRANCE
    - Significant food & beverage industry to drive growth
    SPAIN
    - Large alcoholic and non-alcoholic beverage industries to boost market
    ITALY
    - Export of processed food to fuel market growth
    REST OF EUROPE
  • 14.5 SOUTH AMERICA
    BRAZIL
    - Rising demand for packaged food to boost market
    ARGENTINA
    - Extension of shelf life of food & beverages through packaging to propel market
    REST OF SOUTH AMERICA
  • 14.6 REST OF THE WORLD (ROW)
    MIDDLE EAST
    - Increasing consumer preference for canned carbonated and non-carbonated beverages to fuel market
    AFRICA
    - Rapid urbanization and shifting consumer preferences toward sports and energy drinks to drive market growth
COMPETITIVE LANDSCAPE
222
  • 15.1 OVERVIEW
  • 15.2 KEY PLAYERS’ STRATEGIES/RIGHT TO WIN
  • 15.3 REVENUE ANALYSIS
  • 15.4 KEY PLAYERS’ ANNUAL REVENUE VS. GROWTH
  • 15.5 KEY PLAYERS’ EBITDA
  • 15.6 GLOBAL SNAPSHOT OF KEY MARKET PARTICIPANTS
  • 15.7 MARKET SHARE ANALYSIS, 2023
  • 15.8 BRAND/PRODUCT COMPARISON
  • 15.9 COMPANY EVALUATION MATRIX: KEY PLAYERS, 2023
    STARS
    EMERGING LEADERS
    PERVASIVE PLAYERS
    PARTICIPANTS
    COMPANY FOOTPRINT: KEY PLAYERS, 2023
    - Company footprint
    - Region footprint
    - Product type footprint
    - Application footprint
  • 15.10 COMPANY EVALUATION MATRIX: STARTUPS/SMES, 2023
    PROGRESSIVE COMPANIES
    RESPONSIVE COMPANIES
    DYNAMIC COMPANIES
    STARTING BLOCKS
    COMPETITIVE BENCHMARKING: STARTUPS/SMES, 2023
    - Detailed list of key startups/SMEs
    - Competitive benchmarking of key startups/SMEs
  • 15.11 COMPETITIVE SCENARIO
    PRODUCT LAUNCHES
    DEALS
    EXPANSIONS
    OTHER DEVELOPMENTS
COMPANY PROFILES
249
  • 16.1 KEY PLAYERS
    CROWN HOLDINGS, INC.
    - Business overview
    - Products/Solutions/Services offered
    - Recent developments
    - MnM view
    BALL CORPORATION
    - Business overview
    - Products/Solutions/Services offered
    - Recent developments
    - MnM view
    ARDAGH GROUP
    - Business overview
    - Products/Solutions/Services offered
    - Recent developments
    - MnM view
    CANPACK GROUP
    - Business overview
    - Products/Solutions/Services offered
    - Recent developments
    - MnM view
    TOYO SEIKAN GROUP HOLDINGS, LTD.
    - Business overview
    - Products/Solutions/Services offered
    - Recent developments
    - MnM view
    SILGAN HOLDINGS INC.
    - Business overview
    - Products/Solutions/Services offered
    - Recent developments
    - MnM view
    CPMC HOLDINGS LIMITED
    - Business overview
    - Products/Solutions/Services offered
    - Recent developments
    - MnM view
    CCL INDUSTRIES
    - Business overview
    - Products/Solutions/Services offered
    - Recent developments
    - MnM view
    SHETRON GROUP
    - Business overview
    - Products/Solutions/Services offered
    - MnM view
    KIAN JOO GROUP
    - Business overview
    - Products/Solutions/Services offered
    - Recent developments
    - MnM view
    ENVASES
    - Business overview
    - Products/Solutions/Services offered
    - Recent developments
    - MnM view
    UNIVERSAL CAN CORPORATION
    - Business overview
    - Products/Solutions/Services offered
    - MnM view
    INDEPENDENT CAN COMPANY
    - Business overview
    - Products/Solutions/Services offered
    - MnM view
    VISY
    - Business overview
    - Products/Solutions/Services offered
    - MnM view
    MAUSER PACKAGING SOLUTIONS
    - Business overview
    - Products/Solutions/Services offered
    - Recent developments
    - MnM view
  • 16.2 OTHER PLAYERS
    P. WILKINSON CONTAINERS LTD.
    - Business overview
    - Products/Solutions/Services offered
    - MnM view
    LAGEEN FOOD PACKAGING
    - Business overview
    - Products/Solutions/Services offered
    - MnM view
    MASSILLY HOLDING S.A.S
    - Business overview
    - Products/Solutions/Services offered
    - MnM view
    JAMESTRONG PACKAGING
    - Business overview
    - Products/Solutions/Services offered
    - MnM view
    KINGCAN HOLDINGS LIMITED
    - Business overview
    - Products/Solutions/Services offered
    - MnM view
    MÜLLER AND BAUER GMBH & CO. KG.
    HINDUSTAN TIN WORKS LIMITED
    VOBEV
    SCAN HOLDINGS
    ALNA PACKAGING CO. LTD.
ADJACENT AND RELATED MARKETS
314
  • 17.1 INTRODUCTION
  • 17.2 LIMITATIONS
  • 17.3 BEVERAGE PACKAGING MARKET
    MARKET DEFINITION
    MARKET OVERVIEW
  • 17.4 FRESH FOOD PACKAGING MARKET
    MARKET DEFINITION
    MARKET OVERVIEW
APPENDIX
318
  • 18.1 DISCUSSION GUIDE
  • 18.2 KNOWLEDGESTORE: MARKETSANDMARKETS’ SUBSCRIPTION PORTAL
  • 18.3 CUSTOMIZATION OPTIONS
  • 18.4 RELATED REPORTS
  • 18.5 AUTHOR DETAILS
LIST OF FIGURES
 
  • TABLE 1 USD EXCHANGE RATES CONSIDERED, 2020–2023
  • TABLE 2 FOOD & BEVERAGE METAL CANS MARKET SHARE SNAPSHOT, 2024 VS. 2029 (USD BILLION)
  • TABLE 3 IMPACT OF MACROECONOMIC FACTORS
  • TABLE 4 SIGNIFICANT BEVERAGE COMPANY INVESTMENTS IN TWO-PIECE BEVERAGE CANS IN 2024
  • TABLE 5 PACKAGING MATERIAL RECYCLING RATES FOR PAPER AND WOOD, 2017–2020
  • TABLE 6 TOP 10 EXPORTERS OF HS CODE 731021, 2020–2023 (USD)
  • TABLE 7 TOP 10 EXPORTERS OF HS CODE 731021, 2020–2023 (KG)
  • TABLE 8 TOP 10 IMPORTERS OF HS CODE 731021, 2020–2023 (USD)
  • TABLE 9 TOP 10 IMPORTERS OF HS CODE 731021, 2020–2023 (KG)
  • TABLE 10 AVERAGE SELLING PRICE, BY FABRICATION TYPE, 2020–2023 (USD/UNIT)
  • TABLE 11 AVERAGE SELLING PRICE, BY REGION, 2020–2023 (USD/UNIT)
  • TABLE 12 FOOD & BEVERAGE METAL CANS MARKET: ECOSYSTEM
  • TABLE 13 PATENTS PERTAINING TO FOOD & BEVERAGE METAL CANS, 2020–2024
  • TABLE 14 KEY CONFERENCES & EVENTS IN FOOD & BEVERAGE METAL CANS MARKET, 2024–2025
  • TABLE 15 NORTH AMERICA: LIST OF REGULATORY BODIES, GOVERNMENT AGENCIES, AND OTHER ORGANIZATIONS
  • TABLE 16 EUROPE: LIST OF REGULATORY BODIES, GOVERNMENT AGENCIES, AND OTHER ORGANIZATIONS
  • TABLE 17 ASIA PACIFIC: LIST OF REGULATORY BODIES, GOVERNMENT AGENCIES, AND OTHER ORGANIZATIONS
  • TABLE 18 FOOD & BEVERAGE METAL CANS MARKET: PORTER’S FIVE FORCES ANALYSIS
  • TABLE 19 INFLUENCE OF STAKEHOLDERS ON BUYING PROCESS FOR FOOD & BEVERAGE METAL CANS
  • TABLE 20 KEY BUYING CRITERIA FOR KEY METAL CAN APPLICATIONS
  • TABLE 21 BEVERAGE CANS TO BE ESTHETICALLY APPEALING
  • TABLE 22 BALL CORPORATION: AI INTEGRATION ENHANCING EFFICIENCY
  • TABLE 23 FOOD & BEVERAGE METAL CANS MARKET, BY FABRICATION TYPE, 2020–2023 (USD BILLION)
  • TABLE 24 FOOD & BEVERAGE METAL CANS MARKET, BY FABRICATION TYPE, 2024–2029 (USD BILLION)
  • TABLE 25 FOOD & BEVERAGE METAL CANS MARKET, BY FABRICATION TYPE, 2020–2023 (BILLION UNITS)
  • TABLE 26 FOOD & BEVERAGE METAL CANS MARKET, BY FABRICATION TYPE, 2024–2029 (BILLION UNITS)
  • TABLE 27 2-PIECE: FOOD & BEVERAGE METAL CANS MARKET, BY REGION, 2020–2023 (USD BILLION)
  • TABLE 28 2-PIECE: FOOD & BEVERAGE METAL CANS MARKET, BY REGION, 2024–2029 (USD BILLION)
  • TABLE 29 2-PIECE: FOOD & BEVERAGE METAL CANS MARKET, BY REGION, 2020–2023 (BILLION UNITS)
  • TABLE 30 2-PIECE: FOOD & BEVERAGE METAL CANS MARKET, BY REGION, 2024–2029 (BILLION UNITS)
  • TABLE 31 3-PIECE: FOOD & BEVERAGE METAL CANS MARKET, BY REGION, 2020–2023 (USD BILLION)
  • TABLE 32 3-PIECE: FOOD & BEVERAGE METAL CANS MARKET, BY REGION, 2024–2029 (USD BILLION)
  • TABLE 33 3-PIECE: FOOD & BEVERAGE METAL CANS MARKET, BY REGION, 2020–2023 (BILLION UNITS)
  • TABLE 34 3-PIECE: FOOD & BEVERAGE METAL CANS MARKET, BY REGION, 2024–2029 (BILLION UNITS)
  • TABLE 35 FOOD & BEVERAGE METAL CANS MARKET, BY MATERIAL TYPE, 2020–2023 (USD BILLION)
  • TABLE 36 FOOD & BEVERAGE METAL CANS MARKET, BY MATERIAL TYPE, 2024–2029 (USD BILLION)
  • TABLE 37 FOOD & BEVERAGE METAL CANS MARKET, BY MATERIAL TYPE, 2020–2023 (BILLION UNITS)
  • TABLE 38 FOOD & BEVERAGE METAL CANS MARKET, BY MATERIAL TYPE, 2024–2029 (BILLION UNITS)
  • TABLE 39 ALUMINUM: FOOD & BEVERAGE METAL CANS MARKET, BY REGION, 2020–2023 (USD BILLION)
  • TABLE 40 ALUMINUM: FOOD & BEVERAGE METAL CANS MARKET, BY REGION, 2024–2029 (USD BILLION)
  • TABLE 41 ALUMINUM: FOOD & BEVERAGE METAL CANS MARKET, BY REGION, 2020–2023 (BILLION UNITS)
  • TABLE 42 ALUMINUM: FOOD & BEVERAGE METAL CANS MARKET, BY REGION, 2024–2029 (BILLION UNITS)
  • TABLE 43 FOOD & BEVERAGE METAL CANS MARKET, BY MATERIAL SUBSEGMENT, 2020–2023 (USD BILLION)
  • TABLE 44 FOOD & BEVERAGE METAL CANS MARKET, BY MATERIAL SUBSEGMENT, 2024–2029 (USD BILLION)
  • TABLE 45 STEEL: FOOD & BEVERAGE METAL CANS MARKET, BY REGION, 2020–2023 (USD BILLION)
  • TABLE 46 STEEL: FOOD & BEVERAGE METAL CANS MARKET, BY REGION, 2024–2029 (USD BILLION)
  • TABLE 47 STEEL: FOOD & BEVERAGE METAL CANS MARKET, BY REGION, 2020–2023 (BILLION UNITS)
  • TABLE 48 STEEL: FOOD & BEVERAGE METAL CANS MARKET, BY REGION, 2024–2029 (BILLION UNITS)
  • TABLE 49 FOOD & BEVERAGE METAL CANS MARKET, BY COATING TYPE, 2020–2023 (USD BILLION)
  • TABLE 50 FOOD & BEVERAGE METAL CANS MARKET, BY COATING TYPE, 2024–2029 (USD BILLION)
  • TABLE 51 FOOD & BEVERAGE METAL CANS MARKET, BY COATING TYPE, 2020–2023 (BILLION UNITS)
  • TABLE 52 FOOD & BEVERAGE METAL CANS MARKET, BY COATING TYPE, 2024–2029 (BILLION UNITS)
  • TABLE 53 WHITE BASE COATING: FOOD & BEVERAGE METAL CANS MARKET, BY REGION, 2020–2023 (USD BILLION)
  • TABLE 54 WHITE BASE COATING: FOOD & BEVERAGE METAL CANS MARKET, BY REGION, 2024–2029 (USD BILLION)
  • TABLE 55 WHITE BASE COATING: FOOD & BEVERAGE METAL CANS MARKET, BY REGION, 2020–2023 (BILLION UNITS)
  • TABLE 56 WHITE BASE COATING: FOOD & BEVERAGE METAL CANS MARKET, BY REGION, 2024–2029 (BILLION UNITS)
  • TABLE 57 BRIGHT COATING: FOOD & BEVERAGE METAL CANS MARKET, BY REGION, 2020–2023 (USD BILLION)
  • TABLE 58 BRIGHT COATING: FOOD & BEVERAGE METAL CANS MARKET, BY REGION, 2024–2029 (USD BILLION)
  • TABLE 59 BRIGHT COATING: FOOD & BEVERAGE METAL CANS MARKET, BY REGION, 2020–2023 (BILLION UNITS)
  • TABLE 60 BRIGHT COATING: FOOD & BEVERAGE METAL CANS MARKET, BY REGION, 2024–2029 (BILLION UNITS)
  • TABLE 61 FOOD & BEVERAGE METAL CANS MARKET, BY APPLICATION, 2020–2023 (USD BILLION)
  • TABLE 62 FOOD & BEVERAGE METAL CANS MARKET, BY APPLICATION, 2024–2029 (USD BILLION)
  • TABLE 63 FOOD & BEVERAGE METAL CANS MARKET, BY APPLICATION, 2020–2023 (BILLION UNITS)
  • TABLE 64 FOOD & BEVERAGE METAL CANS MARKET, BY APPLICATION, 2024–2029 (BILLION UNITS)
  • TABLE 65 FOOD: FOOD & BEVERAGE METAL CANS MARKET, BY REGION, 2020–2023 (USD BILLION)
  • TABLE 66 FOOD: FOOD & BEVERAGE METAL CANS MARKET, BY REGION, 2024–2029 (USD BILLION)
  • TABLE 67 FOOD: FOOD & BEVERAGE METAL CANS MARKET, BY REGION, 2020–2023 (BILLION UNITS)
  • TABLE 68 FOOD: FOOD & BEVERAGE METAL CANS MARKET, BY REGION, 2024–2029 (BILLION UNITS)
  • TABLE 69 FRUITS & VEGETABLES: FOOD & BEVERAGE METAL CANS MARKET, BY REGION, 2020–2023 (USD BILLION)
  • TABLE 70 FRUITS AND VEGETABLES: FOOD & BEVERAGE METAL CANS MARKET, BY REGION, 2024–2029 (USD BILLION)
  • TABLE 71 FRUITS & VEGETABLES: FOOD & BEVERAGE METAL CANS MARKET, BY REGION, 2020–2023 (BILLION UNITS)
  • TABLE 72 FRUITS & VEGETABLES: FOOD & BEVERAGE METAL CANS MARKET, BY REGION, 2024–2029 (BILLION UNITS)
  • TABLE 73 CONVENIENCE FOODS: FOOD & BEVERAGE METAL CANS MARKET, BY REGION, 2020–2023 (USD BILLION)
  • TABLE 74 CONVENIENCE FOODS: FOOD & BEVERAGE METAL CANS MARKET, BY REGION, 2024–2029 (USD BILLION)
  • TABLE 75 CONVENIENCE FOODS: FOOD & BEVERAGE METAL CANS MARKET, BY REGION, 2020–2023 (BILLION UNITS)
  • TABLE 76 CONVENIENCE FOODS: FOOD & BEVERAGE METAL CANS MARKET, BY REGION, 2024–2029 (BILLION UNITS)
  • TABLE 77 PET FOOD: FOOD & BEVERAGE METAL CANS MARKET, BY REGION, 2020–2023 (USD BILLION)
  • TABLE 78 PET FOOD: FOOD & BEVERAGE METAL CANS MARKET, BY REGION, 2024–2029 (USD BILLION)
  • TABLE 79 PET FOOD: FOOD & BEVERAGE METAL CANS MARKET, BY REGION, 2020–2023 (BILLION UNITS)
  • TABLE 80 PET FOOD: FOOD & BEVERAGE METAL CANS MARKET, BY REGION, 2024–2029 (BILLION UNITS)
  • TABLE 81 MEAT & SEAFOOD: FOOD & BEVERAGE METAL CANS MARKET, BY REGION, 2020–2023 (USD BILLION)
  • TABLE 82 MEAT & SEAFOOD: FOOD & BEVERAGE METAL CANS MARKET, BY REGION, 2024–2029 (USD BILLION)
  • TABLE 83 MEAT & SEAFOOD: FOOD & BEVERAGE METAL CANS MARKET, BY REGION, 2020–2023 (BILLION UNITS)
  • TABLE 84 MEAT & SEAFOOD: FOOD & BEVERAGE METAL CANS MARKET, BY REGION, 2024–2029 (BILLION UNITS)
  • TABLE 85 OTHER FOOD PRODUCTS: FOOD & BEVERAGE METAL CANS MARKET, BY REGION, 2020–2023 (USD BILLION)
  • TABLE 86 OTHER FOOD PRODUCTS: FOOD & BEVERAGE METAL CANS MARKET, BY REGION, 2024–2029 (USD BILLION)
  • TABLE 87 OTHER FOOD PRODUCTS: FOOD & BEVERAGE METAL CANS MARKET, BY REGION, 2020–2023 (BILLION UNITS)
  • TABLE 88 OTHER FOOD PRODUCTS: FOOD & BEVERAGE METAL CANS MARKET, BY REGION, 2024–2029 (BILLION UNITS)
  • TABLE 89 BEVERAGES: FOOD & BEVERAGE METAL CANS MARKET, BY REGION, 2020–2023 (USD BILLION)
  • TABLE 90 BEVERAGES: FOOD & BEVERAGE METAL CANS MARKET, BY REGION, 2024–2029 (USD BILLION)
  • TABLE 91 BEVERAGES: FOOD & BEVERAGE METAL CANS MARKET, BY REGION, 2020–2023 (BILLION UNITS)
  • TABLE 92 BEVERAGES: FOOD & BEVERAGE METAL CANS MARKET, BY REGION, 2024–2029 (BILLION UNITS)
  • TABLE 93 ALCOHOLIC BEVERAGES: FOOD & BEVERAGE METAL CANS MARKET, BY REGION, 2020–2023 (USD BILLION)
  • TABLE 94 ALCOHOLIC BEVERAGES: FOOD & BEVERAGE METAL CANS MARKET, BY REGION, 2024–2029 (USD BILLION)
  • TABLE 95 ALCOHOLIC BEVERAGES: FOOD & BEVERAGE METAL CANS MARKET, BY REGION, 2020–2023 (BILLION UNITS)
  • TABLE 96 ALCOHOLIC BEVERAGES: FOOD & BEVERAGE METAL CANS MARKET, BY REGION, 2024–2029 (BILLION UNITS)
  • TABLE 97 CARBONATED SOFT DRINKS: FOOD & BEVERAGE METAL CANS MARKET, BY REGION, 2020–2023 (USD BILLION)
  • TABLE 98 CARBONATED SOFT DRINKS: FOOD & BEVERAGE METAL CANS MARKET, BY REGION, 2024–2029 (USD BILLION)
  • TABLE 99 CARBONATED SOFT DRINKS: FOOD & BEVERAGE METAL CANS MARKET, BY REGION, 2020–2023 (BILLION UNITS)
  • TABLE 100 CARBONATED SOFT DRINKS: FOOD & BEVERAGE METAL CANS MARKET, BY REGION, 2024–2029 (BILLION UNITS)
  • TABLE 101 SPORTS & ENERGY DRINKS: FOOD & BEVERAGE METAL CANS MARKET, BY REGION, 2020–2023 (USD BILLION)
  • TABLE 102 SPORTS & ENERGY DRINKS: FOOD & BEVERAGE METAL CANS MARKET, BY REGION, 2024–2029 (USD BILLION)
  • TABLE 103 SPORTS & ENERGY DRINKS: FOOD & BEVERAGE METAL CANS MARKET, BY REGION, 2020–2023 (BILLION UNITS)
  • TABLE 104 SPORTS & ENERGY DRINKS: FOOD & BEVERAGE METAL CANS MARKET, BY REGION, 2024–2029 (BILLION UNITS)
  • TABLE 105 OTHER BEVERAGES: FOOD & BEVERAGE METAL CANS MARKET, BY REGION, 2020–2023 (USD BILLION)
  • TABLE 106 OTHER BEVERAGES: FOOD & BEVERAGE METAL CANS MARKET, BY REGION, 2024–2029 (USD BILLION)
  • TABLE 107 OTHER BEVERAGES: FOOD & BEVERAGE METAL CANS MARKET, BY REGION, 2020–2023 (BILLION UNITS)
  • TABLE 108 OTHER BEVERAGES: FOOD & BEVERAGE METAL CANS MARKET, BY REGION, 2024–2029 (BILLION UNITS)
  • TABLE 109 FOOD & BEVERAGE METAL CANS MARKET, BY BEVERAGE CAN CAPACITY, 2020–2023 (USD BILLION)
  • TABLE 110 FOOD & BEVERAGE METAL CANS MARKET, BY BEVERAGE CAN CAPACITY, 2024–2029 (USD BILLION)
  • TABLE 111 FOOD & BEVERAGE METAL CANS MARKET, BY REGION, 2020–2023 (USD BILLION)
  • TABLE 112 FOOD & BEVERAGE METAL CANS MARKET, BY REGION, 2024–2029 (USD BILLION)
  • TABLE 113 FOOD & BEVERAGE METAL CANS MARKET, BY REGION, 2020–2023 (BILLION UNITS)
  • TABLE 114 FOOD & BEVERAGE METAL CANS MARKET, BY REGION, 2024–2029 (BILLION UNITS)
  • TABLE 115 NORTH AMERICA: FOOD & BEVERAGE METAL CANS MARKET, BY COUNTRY, 2020–2023 (USD BILLION)
  • TABLE 116 NORTH AMERICA: FOOD & BEVERAGE METAL CANS MARKET, BY COUNTRY, 2024–2029 (USD BILLION)
  • TABLE 117 NORTH AMERICA: FOOD & BEVERAGE METAL CANS MARKET, BY COUNTRY, 2020–2023 (BILLION UNITS)
  • TABLE 118 NORTH AMERICA: FOOD & BEVERAGE METAL CANS MARKET, BY COUNTRY, 2024–2029 (BILLION UNITS)
  • TABLE 119 NORTH AMERICA: FOOD & BEVERAGE METAL CANS MARKET, BY FABRICATION TYPE, 2020–2023 (USD BILLION)
  • TABLE 120 NORTH AMERICA: FOOD & BEVERAGE METAL CANS MARKET, BY FABRICATION TYPE, 2024–2029 (USD BILLION)
  • TABLE 121 NORTH AMERICA: FOOD & BEVERAGE METAL CANS MARKET, BY FABRICATION TYPE, 2020–2023 (BILLION UNITS)
  • TABLE 122 NORTH AMERICA: FOOD & BEVERAGE METAL CANS MARKET, BY FABRICATION TYPE, 2024–2029 (BILLION UNITS)
  • TABLE 123 NORTH AMERICA: FOOD & BEVERAGE METAL CANS MARKET, BY MATERIAL TYPE, 2020–2023 (USD BILLION)
  • TABLE 124 NORTH AMERICA: FOOD & BEVERAGE METAL CANS MARKET, BY MATERIAL TYPE, 2024–2029 (USD BILLION)
  • TABLE 125 NORTH AMERICA: FOOD & BEVERAGE METAL CANS MARKET, BY MATERIAL TYPE, 2020–2023 (BILLION UNITS)
  • TABLE 126 NORTH AMERICA: FOOD & BEVERAGE METAL CANS MARKET, BY MATERIAL TYPE, 2024–2029 (BILLION UNITS)
  • TABLE 127 NORTH AMERICA: FOOD & BEVERAGE METAL CANS MARKET, BY COATING TYPE, 2020–2023 (USD BILLION)
  • TABLE 128 NORTH AMERICA: FOOD & BEVERAGE METAL CANS MARKET, BY COATING TYPE, 2024–2029 (USD BILLION)
  • TABLE 129 NORTH AMERICA: FOOD & BEVERAGE METAL CANS MARKET, BY COATING TYPE, 2020–2023 (BILLION UNITS)
  • TABLE 130 NORTH AMERICA: FOOD & BEVERAGE METAL CANS MARKET, BY COATING TYPE, 2024–2029 (BILLION UNITS)
  • TABLE 131 NORTH AMERICA: FOOD & BEVERAGE METAL CANS MARKET, BY APPLICATION, 2020–2023 (USD BILLION)
  • TABLE 132 NORTH AMERICA: FOOD & BEVERAGE METAL CANS MARKET, BY APPLICATION, 2024–2029 (USD BILLION)
  • TABLE 133 NORTH AMERICA: FOOD & BEVERAGE METAL CANS MARKET, BY APPLICATION, 2020–2023 (BILLION UNITS)
  • TABLE 134 NORTH AMERICA: FOOD & BEVERAGE METAL CANS MARKET, BY APPLICATION, 2024–2029 (BILLION UNITS)
  • TABLE 135 NORTH AMERICA: FOOD & BEVERAGE METAL CANS MARKET, BY FOOD SUBSEGMENT, 2020–2023 (USD BILLION)
  • TABLE 136 NORTH AMERICA: FOOD & BEVERAGE METAL CANS MARKET, BY FOOD SUBSEGMENT, 2024–2029 (USD BILLION)
  • TABLE 137 NORTH AMERICA: FOOD & BEVERAGE METAL CANS MARKET, BY FOOD SUBSEGMENT, 2020–2023 (BILLION UNITS)
  • TABLE 138 NORTH AMERICA: FOOD & BEVERAGE METAL CANS MARKET, BY FOOD SUBSEGMENT, 2024–2029 (BILLION UNITS)
  • TABLE 139 NORTH AMERICA: FOOD & BEVERAGE METAL CANS MARKET, BY BEVERAGE SUBSEGMENT, 2020–2023 (USD BILLION)
  • TABLE 140 NORTH AMERICA: FOOD & BEVERAGE METAL CANS MARKET, BY BEVERAGE SUBSEGMENT, 2024–2029 (USD BILLION)
  • TABLE 141 NORTH AMERICA: FOOD & BEVERAGE METAL CANS MARKET, BY BEVERAGE SUBSEGMENT, 2020–2023 (BILLION UNITS)
  • TABLE 142 NORTH AMERICA: FOOD & BEVERAGE METAL CANS MARKET, BY BEVERAGE SUBSEGMENT, 2024–2029 (BILLION UNITS)
  • TABLE 143 US: FOOD & BEVERAGE METAL CANS MARKET, BY APPLICATION, 2020–2023 (USD BILLION)
  • TABLE 144 US: FOOD & BEVERAGE METAL CANS MARKET, BY APPLICATION, 2024–2029 (USD BILLION)
  • TABLE 145 US: FOOD & BEVERAGE METAL CANS MARKET, BY APPLICATION, 2020–2023 (BILLION UNITS)
  • TABLE 146 US: FOOD & BEVERAGE METAL CANS MARKET, BY APPLICATION, 2024–2029 (BILLION UNITS)
  • TABLE 147 CANADA: FOOD & BEVERAGE METAL CANS MARKET, BY APPLICATION, 2020–2023 (USD BILLION)
  • TABLE 148 CANADA: FOOD & BEVERAGE METAL CANS MARKET, BY APPLICATION, 2024–2029 (USD BILLION)
  • TABLE 149 CANADA: FOOD & BEVERAGE METAL CANS MARKET, BY APPLICATION, 2020–2023 (BILLION UNITS)
  • TABLE 150 CANADA: FOOD & BEVERAGE METAL CANS MARKET, BY APPLICATION, 2024–2029 (BILLION UNITS)
  • TABLE 151 MEXICO: FOOD & BEVERAGE METAL CANS MARKET, BY APPLICATION, 2020–2023 (USD BILLION)
  • TABLE 152 MEXICO: FOOD & BEVERAGE METAL CANS MARKET, BY APPLICATION, 2024–2029 (USD BILLION)
  • TABLE 153 MEXICO: FOOD & BEVERAGE METAL CANS MARKET, BY APPLICATION, 2020–2023 (BILLION UNITS)
  • TABLE 154 MEXICO: FOOD & BEVERAGE METAL CANS MARKET, BY APPLICATION, 2024–2029 (BILLION UNITS)
  • TABLE 155 ASIA PACIFIC: FOOD & BEVERAGE METAL CANS MARKET, BY COUNTRY, 2020–2023 (USD BILLION)
  • TABLE 156 ASIA PACIFIC: FOOD & BEVERAGE METAL CANS MARKET, BY COUNTRY, 2024–2029 (USD BILLION)
  • TABLE 157 ASIA PACIFIC: FOOD & BEVERAGE METAL CANS MARKET, BY COUNTRY, 2020–2023 (BILLION UNITS)
  • TABLE 158 ASIA PACIFIC: FOOD & BEVERAGE METAL CANS MARKET, BY COUNTRY, 2024–2029 (BILLION UNITS)
  • TABLE 159 ASIA PACIFIC: FOOD & BEVERAGE METAL CANS MARKET, BY FABRICATION TYPE, 2020–2023 (USD BILLION)
  • TABLE 160 ASIA PACIFIC: FOOD & BEVERAGE METAL CANS MARKET, BY FABRICATION TYPE, 2024–2029 (USD BILLION)
  • TABLE 161 ASIA PACIFIC: FOOD & BEVERAGE METAL CANS MARKET, BY FABRICATION TYPE, 2020–2023 (BILLION UNITS)
  • TABLE 162 ASIA PACIFIC: FOOD & BEVERAGE METAL CANS MARKET, BY FABRICATION TYPE, 2024–2029 (BILLION UNITS)
  • TABLE 163 ASIA PACIFIC: FOOD & BEVERAGE METAL CANS MARKET, BY COATING TYPE, 2020–2023 (USD BILLION)
  • TABLE 164 ASIA PACIFIC: FOOD & BEVERAGE METAL CANS MARKET, BY COATING TYPE, 2024–2029 (USD BILLION)
  • TABLE 165 ASIA PACIFIC: FOOD & BEVERAGE METAL CANS MARKET, BY COATING TYPE, 2020–2023 (BILLION UNITS)
  • TABLE 166 ASIA PACIFIC: FOOD & BEVERAGE METAL CANS MARKET, BY COATING TYPE, 2024–2029 (BILLION UNITS)
  • TABLE 167 ASIA PACIFIC: FOOD & BEVERAGE METAL CANS MARKET, BY APPLICATION, 2020–2023 (USD BILLION)
  • TABLE 168 ASIA PACIFIC: FOOD & BEVERAGE METAL CANS MARKET, BY APPLICATION, 2024–2029 (USD BILLION)
  • TABLE 169 ASIA PACIFIC: FOOD & BEVERAGE METAL CANS MARKET, BY APPLICATION, 2020–2023 (BILLION UNITS)
  • TABLE 170 ASIA PACIFIC: FOOD & BEVERAGE METAL CANS MARKET, BY APPLICATION, 2024–2029 (BILLION UNITS)
  • TABLE 171 ASIA PACIFIC: FOOD & BEVERAGE METAL CANS MARKET, BY FOOD SUBSEGMENT, 2020–2023 (USD BILLION)
  • TABLE 172 ASIA PACIFIC: FOOD & BEVERAGE METAL CANS MARKET, BY FOOD SUBSEGMENT, 2024–2029 (USD BILLION)
  • TABLE 173 ASIA PACIFIC: FOOD & BEVERAGE METAL CANS MARKET, BY FOOD SUBSEGMENT, 2020–2023 (BILLION UNITS)
  • TABLE 174 ASIA PACIFIC: FOOD & BEVERAGE METAL CANS MARKET, BY FOOD SUBSEGMENT, 2024–2029 (BILLION UNITS)
  • TABLE 175 ASIA PACIFIC: FOOD & BEVERAGE METAL CANS MARKET, BY BEVERAGES SUBSEGMENT, 2020–2023 (USD BILLION)
  • TABLE 176 ASIA PACIFIC: FOOD & BEVERAGE METAL CANS MARKET, BY BEVERAGES SUBSEGMENT, 2024–2029 (USD BILLION)
  • TABLE 177 ASIA PACIFIC: FOOD & BEVERAGE METAL CANS MARKET, BY BEVERAGES SUBSEGMENT, 2020–2023 (BILLION UNITS)
  • TABLE 178 ASIA PACIFIC: FOOD & BEVERAGE METAL CANS MARKET, BY BEVERAGES SUBSEGMENT, 2024–2029 (BILLION UNITS)
  • TABLE 179 CHINA: FOOD & BEVERAGE METAL CANS MARKET, BY APPLICATION, 2020–2023 (USD BILLION)
  • TABLE 180 CHINA: FOOD & BEVERAGE METAL CANS MARKET, BY APPLICATION, 2024–2029 (USD BILLION)
  • TABLE 181 CHINA: FOOD & BEVERAGE METAL CANS MARKET, BY APPLICATION, 2020–2023 (BILLION UNITS)
  • TABLE 182 CHINA: FOOD & BEVERAGE METAL CANS MARKET, BY APPLICATION, 2024–2029 (BILLION UNITS)
  • TABLE 183 INDIA: FOOD & BEVERAGE METAL CANS MARKET, BY APPLICATION, 2020–2023 (USD BILLION)
  • TABLE 184 INDIA: FOOD & BEVERAGE METAL CANS MARKET, BY APPLICATION, 2024–2029 (USD BILLION)
  • TABLE 185 INDIA: FOOD & BEVERAGE METAL CANS MARKET, BY APPLICATION, 2020–2023 (BILLION UNITS)
  • TABLE 186 INDIA: FOOD & BEVERAGE METAL CANS MARKET, BY APPLICATION, 2024–2029 (BILLION UNITS)
  • TABLE 187 THAILAND: FOOD & BEVERAGE METAL CANS MARKET, BY APPLICATION, 2020–2023 (USD BILLION)
  • TABLE 188 THAILAND: FOOD & BEVERAGE METAL CANS MARKET, BY APPLICATION, 2024–2029 (USD BILLION)
  • TABLE 189 THAILAND: FOOD & BEVERAGE METAL CANS MARKET, BY APPLICATION, 2020–2023 (BILLION UNITS)
  • TABLE 190 THAILAND: FOOD & BEVERAGE METAL CANS MARKET, BY APPLICATION, 2024–2029 (BILLION UNITS)
  • TABLE 191 INDONESIA: FOOD & BEVERAGE METAL CANS MARKET, BY APPLICATION, 2020–2023 (USD BILLION)
  • TABLE 192 INDONESIA: FOOD & BEVERAGE METAL CANS MARKET, BY APPLICATION, 2024–2029 (USD BILLION)
  • TABLE 193 INDONESIA: FOOD & BEVERAGE METAL CANS MARKET, BY APPLICATION, 2020–2023 (BILLION UNITS)
  • TABLE 194 INDONESIA: FOOD & BEVERAGE METAL CANS MARKET, BY APPLICATION, 2024–2029 (BILLION UNITS)
  • TABLE 195 JAPAN: FOOD & BEVERAGE METAL CANS MARKET, BY APPLICATION, 2020–2023 (USD BILLION)
  • TABLE 196 JAPAN: FOOD & BEVERAGE METAL CANS MARKET, BY APPLICATION, 2024–2029 (USD BILLION)
  • TABLE 197 JAPAN: FOOD & BEVERAGE METAL CANS MARKET, BY APPLICATION, 2020–2023 (BILLION UNITS)
  • TABLE 198 JAPAN: FOOD & BEVERAGE METAL CANS MARKET, BY APPLICATION, 2024–2029 (BILLION UNITS)
  • TABLE 199 AUSTRALIA & NEW ZEALAND: FOOD & BEVERAGE METAL CANS MARKET, BY APPLICATION, 2020–2023 (USD BILLION)
  • TABLE 200 AUSTRALIA & NEW ZEALAND: FOOD & BEVERAGE METAL CANS MARKET, BY APPLICATION, 2024–2029 (USD BILLION)
  • TABLE 201 AUSTRALIA & NEW ZEALAND: FOOD & BEVERAGE METAL CANS MARKET, BY APPLICATION, 2020–2023 (BILLION UNITS)
  • TABLE 202 AUSTRALIA & NEW ZEALAND: FOOD & BEVERAGE METAL CANS MARKET, BY APPLICATION, 2024–2029 (BILLION UNITS)
  • TABLE 203 REST OF ASIA PACIFIC: FOOD & BEVERAGE METAL CANS MARKET, BY APPLICATION, 2020–2023 (USD BILLION)
  • TABLE 204 REST OF ASIA PACIFIC: FOOD & BEVERAGE METAL CANS MARKET, BY APPLICATION, 2024–2029 (USD BILLION)
  • TABLE 205 REST OF ASIA PACIFIC: FOOD & BEVERAGE METAL CANS MARKET, BY APPLICATION, 2020–2023 (BILLION UNITS)
  • TABLE 206 REST OF ASIA PACIFIC: FOOD & BEVERAGE METAL CANS MARKET, BY APPLICATION, 2024–2029 (BILLION UNITS)
  • TABLE 207 EUROPE: FOOD & BEVERAGE METAL CANS MARKET, BY COUNTRY, 2020–2023 (USD BILLION)
  • TABLE 208 EUROPE: FOOD & BEVERAGE METAL CANS MARKET, BY COUNTRY, 2024–2029 (USD BILLION)
  • TABLE 209 EUROPE: FOOD & BEVERAGE METAL CANS MARKET, BY COUNTRY, 2020–2023 (BILLION UNITS)
  • TABLE 210 EUROPE: FOOD & BEVERAGE METAL CANS MARKET, BY COUNTRY, 2024–2029 (BILLION UNITS)
  • TABLE 211 EUROPE: FOOD & BEVERAGE METAL CANS MARKET, BY FABRICATION TYPE, 2020–2023 (USD BILLION)
  • TABLE 212 EUROPE: FOOD & BEVERAGE METAL CANS MARKET, BY FABRICATION TYPE, 2024–2029 (USD BILLION)
  • TABLE 213 EUROPE: FOOD & BEVERAGE METAL CANS MARKET, BY FABRICATION TYPE, 2020–2023 (BILLION UNITS)
  • TABLE 214 EUROPE: FOOD & BEVERAGE METAL CANS MARKET, BY FABRICATION TYPE, 2024–2029 (BILLION UNITS)
  • TABLE 215 EUROPE: FOOD & BEVERAGE METAL CANS MARKET, BY MATERIAL TYPE, 2020–2023 (USD BILLION)
  • TABLE 216 EUROPE: FOOD & BEVERAGE METAL CANS MARKET, BY MATERIAL TYPE, 2024–2029 (USD BILLION)
  • TABLE 217 EUROPE: FOOD & BEVERAGE METAL CANS MARKET, BY MATERIAL TYPE, 2020–2023 (BILLION UNITS)
  • TABLE 218 EUROPE: FOOD & BEVERAGE METAL CANS MARKET, BY MATERIAL TYPE, 2024–2029 (BILLION UNITS)
  • TABLE 219 EUROPE: FOOD & BEVERAGE METAL CANS MARKET, BY COATING TYPE, 2020–2023 (USD BILLION)
  • TABLE 220 EUROPE: FOOD & BEVERAGE METAL CANS MARKET, BY COATING TYPE, 2024–2029 (USD BILLION)
  • TABLE 221 EUROPE: FOOD & BEVERAGE METAL CANS MARKET, BY COATING TYPE, 2020–2023 (BILLION UNITS)
  • TABLE 222 EUROPE: FOOD & BEVERAGE METAL CANS MARKET, BY COATING TYPE, 2024–2029 (BILLION UNITS)
  • TABLE 223 EUROPE: FOOD & BEVERAGE METAL CANS MARKET, BY APPLICATION, 2020–2023 (USD BILLION)
  • TABLE 224 EUROPE: FOOD & BEVERAGE METAL CANS MARKET, BY APPLICATION, 2024–2029 (USD BILLION)
  • TABLE 225 EUROPE: FOOD & BEVERAGE METAL CANS MARKET, BY APPLICATION, 2020–2023 (BILLION UNITS)
  • TABLE 226 EUROPE: FOOD & BEVERAGE METAL CANS MARKET, BY APPLICATION, 2024–2029 (BILLION UNITS)
  • TABLE 227 EUROPE: FOOD & BEVERAGE METAL CANS MARKET, BY FOOD SUBSEGMENT, 2020–2023 (USD BILLION)
  • TABLE 228 EUROPE: FOOD & BEVERAGE METAL CANS MARKET, BY FOOD SUBSEGMENT, 2024–2029 (USD BILLION)
  • TABLE 229 EUROPE: FOOD & BEVERAGE METAL CANS MARKET, BY FOOD SUBSEGMENT, 2020–2023 (BILLION UNITS)
  • TABLE 230 EUROPE: FOOD & BEVERAGE METAL CANS MARKET, BY FOOD SUBSEGMENT, 2024–2029 (BILLION UNITS)
  • TABLE 231 EUROPE: FOOD & BEVERAGE METAL CANS MARKET, BY BEVERAGES SUBSEGMENT, 2020–2023 (USD BILLION)
  • TABLE 232 EUROPE: FOOD & BEVERAGE METAL CANS MARKET, BY BEVERAGES SUBSEGMENT, 2024–2029 (USD BILLION)
  • TABLE 233 EUROPE: FOOD & BEVERAGE METAL CANS MARKET, BY BEVERAGES SUBSEGMENT, 2020–2023 (BILLION UNITS)
  • TABLE 234 EUROPE: FOOD & BEVERAGE METAL CANS MARKET, BY BEVERAGES SUBSEGMENT, 2024–2029 (BILLION UNITS)
  • TABLE 235 GERMANY: FOOD & BEVERAGE METAL CANS MARKET, BY APPLICATION, 2020–2023 (USD BILLION)
  • TABLE 236 GERMANY: FOOD & BEVERAGE METAL CANS MARKET, BY APPLICATION, 2024–2029 (USD BILLION)
  • TABLE 237 GERMANY: FOOD & BEVERAGE METAL CANS MARKET, BY APPLICATION, 2020–2023 (BILLION UNITS)
  • TABLE 238 GERMANY: FOOD & BEVERAGE METAL CANS MARKET, BY APPLICATION, 2024–2029 (BILLION UNITS)
  • TABLE 239 UK: FOOD & BEVERAGE METAL CANS MARKET, BY APPLICATION, 2020–2023 (USD BILLION)
  • TABLE 240 UK: FOOD & BEVERAGE METAL CANS MARKET, BY APPLICATION, 2024–2029 (USD BILLION)
  • TABLE 241 UK: FOOD & BEVERAGE METAL CANS MARKET, BY APPLICATION, 2020–2023 (BILLION UNITS)
  • TABLE 242 UK: FOOD & BEVERAGE METAL CANS MARKET, BY APPLICATION, 2024–2029 (BILLION UNITS)
  • TABLE 243 FRANCE: FOOD & BEVERAGE METAL CANS MARKET, BY APPLICATION, 2020–2023 (USD BILLION)
  • TABLE 244 FRANCE: FOOD & BEVERAGE METAL CANS MARKET, BY APPLICATION, 2024–2029 (USD BILLION)
  • TABLE 245 FRANCE: FOOD & BEVERAGE METAL CANS MARKET, BY APPLICATION, 2020–2023 (BILLION UNITS)
  • TABLE 246 FRANCE: FOOD & BEVERAGE METAL CANS MARKET, BY APPLICATION, 2024–2029 (BILLION UNITS)
  • TABLE 247 SPAIN: FOOD & BEVERAGE METAL CANS MARKET, BY APPLICATION, 2020–2023 (USD BILLION)
  • TABLE 248 SPAIN: FOOD & BEVERAGE METAL CANS MARKET, BY APPLICATION, 2024–2029 (USD BILLION)
  • TABLE 249 SPAIN: FOOD & BEVERAGE METAL CANS MARKET, BY APPLICATION, 2020–2023 (BILLION UNITS)
  • TABLE 250 SPAIN: FOOD & BEVERAGE METAL CANS MARKET, BY APPLICATION, 2024–2029 (BILLION UNITS)
  • TABLE 251 ITALY: FOOD & BEVERAGE METAL CANS MARKET, BY APPLICATION, 2020–2023 (USD BILLION)
  • TABLE 252 ITALY: FOOD & BEVERAGE METAL CANS MARKET, BY APPLICATION, 2024–2029 (USD BILLION)
  • TABLE 253 ITALY: FOOD & BEVERAGE METAL CANS MARKET, BY APPLICATION, 2020–2023 (BILLION UNITS)
  • TABLE 254 ITALY: FOOD & BEVERAGE METAL CANS MARKET, BY APPLICATION, 2024–2029 (BILLION UNITS)
  • TABLE 255 REST OF EUROPE: FOOD & BEVERAGE METAL CANS MARKET, BY APPLICATION, 2020–2023 (USD BILLION)
  • TABLE 256 REST OF EUROPE: FOOD & BEVERAGE METAL CANS MARKET, BY APPLICATION, 2024–2029 (USD BILLION)
  • TABLE 257 REST OF EUROPE: FOOD & BEVERAGE METAL CANS MARKET, BY APPLICATION, 2020–2023 (BILLION UNITS)
  • TABLE 258 REST OF EUROPE: FOOD & BEVERAGE METAL CANS MARKET, BY APPLICATION, 2024–2029 (BILLION UNITS)
  • TABLE 259 SOUTH AMERICA: FOOD & BEVERAGE METAL CANS MARKET, BY COUNTRY, 2020–2023 (USD BILLION)
  • TABLE 260 SOUTH AMERICA: FOOD & BEVERAGE METAL CANS MARKET, BY COUNTRY, 2024–2029 (USD BILLION)
  • TABLE 261 SOUTH AMERICA: FOOD & BEVERAGE METAL CANS MARKET, BY COUNTRY, 2020–2023 (BILLION UNITS)
  • TABLE 262 SOUTH AMERICA: FOOD & BEVERAGE METAL CANS MARKET, BY COUNTRY, 2024–2029 (BILLION UNITS)
  • TABLE 263 SOUTH AMERICA: FOOD & BEVERAGE METAL CANS MARKET, BY FABRICATION TYPE, 2020–2023 (USD BILLION)
  • TABLE 264 SOUTH AMERICA: FOOD & BEVERAGE METAL CANS MARKET, BY FABRICATION TYPE, 2024–2029 (USD BILLION)
  • TABLE 265 SOUTH AMERICA: FOOD & BEVERAGE METAL CANS MARKET, BY FABRICATION TYPE, 2020–2023 (BILLION UNITS)
  • TABLE 266 SOUTH AMERICA: FOOD & BEVERAGE METAL CANS MARKET, BY FABRICATION TYPE, 2024–2029 (BILLION UNITS)
  • TABLE 267 SOUTH AMERICA: FOOD & BEVERAGE METAL CANS MARKET, BY MATERIAL TYPE, 2020–2023 (USD BILLION)
  • TABLE 268 SOUTH AMERICA: FOOD & BEVERAGE METAL CANS MARKET, BY MATERIAL TYPE, 2024–2029 (USD BILLION)
  • TABLE 269 SOUTH AMERICA: FOOD & BEVERAGE METAL CANS MARKET, BY MATERIAL TYPE, 2020–2023 (BILLION UNITS)
  • TABLE 270 SOUTH AMERICA: FOOD & BEVERAGE METAL CANS MARKET, BY MATERIAL TYPE, 2024–2029 (BILLION UNITS)
  • TABLE 271 SOUTH AMERICA: FOOD & BEVERAGE METAL CANS MARKET, BY COATING TYPE, 2020–2023 (USD BILLION)
  • TABLE 272 SOUTH AMERICA: FOOD & BEVERAGE METAL CANS MARKET, BY COATING TYPE, 2024–2029 (USD BILLION)
  • TABLE 273 SOUTH AMERICA: FOOD & BEVERAGE METAL CANS MARKET, BY COATING TYPE, 2020–2023 (BILLION UNITS)
  • TABLE 274 SOUTH AMERICA: FOOD & BEVERAGE METAL CANS MARKET, BY COATING TYPE, 2024–2029 (BILLION UNITS)
  • TABLE 275 SOUTH AMERICA: FOOD & BEVERAGE METAL CANS MARKET, BY APPLICATION, 2020–2023 (USD BILLION)
  • TABLE 276 SOUTH AMERICA: FOOD & BEVERAGE METAL CANS MARKET, BY APPLICATION, 2024–2029 (USD BILLION)
  • TABLE 277 SOUTH AMERICA: FOOD & BEVERAGE METAL CANS MARKET, BY APPLICATION, 2020–2023 (BILLION UNITS)
  • TABLE 278 SOUTH AMERICA: FOOD & BEVERAGE METAL CANS MARKET, BY APPLICATION, 2024–2029 (BILLION UNITS)
  • TABLE 279 SOUTH AMERICA: FOOD & BEVERAGE METAL CANS MARKET, BY FOOD SUBSEGMENT, 2020–2023 (USD BILLION)
  • TABLE 280 SOUTH AMERICA: FOOD & BEVERAGE METAL CANS MARKET, BY FOOD SUBSEGMENT, 2024–2029 (USD BILLION)
  • TABLE 281 SOUTH AMERICA: FOOD & BEVERAGE METAL CANS MARKET, BY FOOD SUBSEGMENT, 2020–2023 (BILLION UNITS)
  • TABLE 282 SOUTH AMERICA: FOOD & BEVERAGE METAL CANS MARKET, BY FOOD SUBSEGMENT, 2024–2029 (BILLION UNITS)
  • TABLE 283 SOUTH AMERICA: FOOD & BEVERAGE METAL CANS MARKET, BY BEVERAGES SUBSEGMENT, 2020–2023 (USD BILLION)
  • TABLE 284 SOUTH AMERICA: FOOD & BEVERAGE METAL CANS MARKET, BY BEVERAGES SUBSEGMENT, 2024–2029 (USD BILLION)
  • TABLE 285 SOUTH AMERICA: FOOD & BEVERAGE METAL CANS MARKET, BY BEVERAGES SUBSEGMENT, 2020–2023 (BILLION UNITS)
  • TABLE 286 SOUTH AMERICA: FOOD & BEVERAGE METAL CANS MARKET, BY BEVERAGES SUBSEGMENT, 2024–2029 (BILLION UNITS)
  • TABLE 287 BRAZIL: FOOD & BEVERAGE METAL CANS MARKET, BY APPLICATION, 2020–2023 (USD BILLION)
  • TABLE 288 BRAZIL: FOOD & BEVERAGE METAL CANS MARKET, BY APPLICATION, 2024–2029 (USD BILLION)
  • TABLE 289 BRAZIL: FOOD & BEVERAGE METAL CANS MARKET, BY APPLICATION, 2020–2023 (BILLION UNITS)
  • TABLE 290 BRAZIL: FOOD & BEVERAGE METAL CANS MARKET, BY APPLICATION, 2024–2029 (BILLION UNITS)
  • TABLE 291 ARGENTINA: FOOD & BEVERAGE METAL CANS MARKET, BY APPLICATION, 2020–2023 (USD BILLION)
  • TABLE 292 ARGENTINA: FOOD & BEVERAGE METAL CANS MARKET, BY APPLICATION, 2024–2029 (USD BILLION)
  • TABLE 293 ARGENTINA: FOOD & BEVERAGE METAL CANS MARKET, BY APPLICATION, 2020–2023 (BILLION UNITS)
  • TABLE 294 ARGENTINA: FOOD & BEVERAGE METAL CANS MARKET, BY APPLICATION, 2024–2029 (BILLION UNITS)
  • TABLE 295 REST OF SOUTH AMERICA: FOOD & BEVERAGE METAL CANS MARKET, BY APPLICATION, 2020–2023 (USD BILLION)
  • TABLE 296 REST OF SOUTH AMERICA: FOOD & BEVERAGE METAL CANS MARKET, BY APPLICATION, 2024–2029 (USD BILLION)
  • TABLE 297 REST OF SOUTH AMERICA: FOOD & BEVERAGE METAL CANS MARKET, BY APPLICATION, 2020–2023 (BILLION UNITS)
  • TABLE 298 REST OF SOUTH AMERICA: FOOD & BEVERAGE METAL CANS MARKET, BY APPLICATION, 2024–2029 (BILLION UNITS)
  • TABLE 299 REST OF THE WORLD: FOOD & BEVERAGE METAL CANS MARKET, BY REGION, 2020–2023 (USD BILLION)
  • TABLE 300 REST OF THE WORLD: FOOD & BEVERAGE METAL CANS MARKET, BY REGION, 2024–2029 (USD BILLION)
  • TABLE 301 REST OF THE WORLD: FOOD & BEVERAGE METAL CANS MARKET, BY REGION, 2020–2023 (BILLION UNITS)
  • TABLE 302 REST OF THE WORLD: FOOD & BEVERAGE METAL CANS MARKET, BY REGION, 2024–2029 (BILLION UNITS)
  • TABLE 303 REST OF THE WORLD: FOOD & BEVERAGE METAL CANS MARKET, BY FABRICATION TYPE, 2020–2023 (USD BILLION)
  • TABLE 304 REST OF THE WORLD: FOOD & BEVERAGE METAL CANS MARKET, BY FABRICATION TYPE, 2024–2029 (USD BILLION)
  • TABLE 305 REST OF THE WORLD: FOOD & BEVERAGE METAL CANS MARKET, BY FABRICATION TYPE, 2020–2023 (BILLION UNITS)
  • TABLE 306 REST OF THE WORLD: FOOD & BEVERAGE METAL CANS MARKET, BY FABRICATION TYPE, 2024–2029 (BILLION UNITS)
  • TABLE 307 REST OF THE WORLD: FOOD & BEVERAGE METAL CANS MARKET, BY MATERIAL TYPE, 2020–2023 (USD BILLION)
  • TABLE 308 REST OF THE WORLD: FOOD & BEVERAGE METAL CANS MARKET, BY MATERIAL TYPE, 2024–2029 (USD BILLION)
  • TABLE 309 REST OF THE WORLD: FOOD & BEVERAGE METAL CANS MARKET, BY MATERIAL TYPE, 2020–2023 (BILLION UNITS)
  • TABLE 310 REST OF THE WORLD: FOOD & BEVERAGE METAL CANS MARKET, BY MATERIAL TYPE, 2024–2029 (BILLION UNITS)
  • TABLE 311 REST OF THE WORLD: FOOD & BEVERAGE METAL CANS MARKET, BY COATING TYPE, 2020–2023 (USD BILLION)
  • TABLE 312 REST OF THE WORLD: FOOD & BEVERAGE METAL CANS MARKET, BY COATING TYPE, 2024–2029 (USD BILLION)
  • TABLE 313 REST OF THE WORLD: FOOD & BEVERAGE METAL CANS MARKET, BY COATING TYPE, 2020–2023 (BILLION UNITS)
  • TABLE 314 REST OF THE WORLD: FOOD & BEVERAGE METAL CANS MARKET, BY COATING TYPE, 2024–2029 (BILLION UNITS)
  • TABLE 315 REST OF THE WORLD: FOOD & BEVERAGE METAL CANS MARKET, BY APPLICATION, 2020–2023 (USD BILLION)
  • TABLE 316 REST OF THE WORLD: FOOD & BEVERAGE METAL CANS MARKET, BY APPLICATION, 2024–2029 (USD BILLION)
  • TABLE 317 REST OF THE WORLD: FOOD & BEVERAGE METAL CANS MARKET, BY APPLICATION, 2020–2023 (BILLION UNITS)
  • TABLE 318 REST OF THE WORLD: FOOD & BEVERAGE METAL CANS MARKET, BY APPLICATION, 2024–2029 (BILLION UNITS)
  • TABLE 319 REST OF THE WORLD: FOOD & BEVERAGE METAL CANS MARKET, BY FOOD SUBSEGMENT, 2020–2023 (USD BILLION)
  • TABLE 320 REST OF THE WORLD: FOOD & BEVERAGE METAL CANS MARKET, BY FOOD SUBSEGMENT, 2024–2029 (USD BILLION)
  • TABLE 321 REST OF THE WORLD: FOOD & BEVERAGE METAL CANS MARKET, BY FOOD SUBSEGMENT, 2020–2023 (BILLION UNITS)
  • TABLE 322 REST OF THE WORLD: FOOD & BEVERAGE METAL CANS MARKET, BY FOOD SUBSEGMENT, 2024–2029 (BILLION UNITS)
  • TABLE 323 REST OF THE WORLD: FOOD & BEVERAGE METAL CANS MARKET, BY BEVERAGES SUBSEGMENT, 2020–2023 (USD BILLION)
  • TABLE 324 REST OF THE WORLD: FOOD & BEVERAGE METAL CANS MARKET, BY BEVERAGES SUBSEGMENT, 2024–2029 (USD BILLION)
  • TABLE 325 REST OF THE WORLD: FOOD & BEVERAGE METAL CANS MARKET, BY BEVERAGES SUBSEGMENT, 2020–2023 (BILLION UNITS)
  • TABLE 326 REST OF THE WORLD: FOOD & BEVERAGE METAL CANS MARKET, BY BEVERAGES SUBSEGMENT, 2024–2029 (BILLION UNITS)
  • TABLE 327 MIDDLE EAST: FOOD & BEVERAGE METAL CANS MARKET, BY APPLICATION, 2020–2023 (USD BILLION)
  • TABLE 328 MIDDLE EAST: FOOD & BEVERAGE METAL CANS MARKET, BY APPLICATION, 2024–2029 (USD BILLION)
  • TABLE 329 MIDDLE EAST: FOOD & BEVERAGE METAL CANS MARKET, BY APPLICATION, 2020–2023 (BILLION UNITS)
  • TABLE 330 MIDDLE EAST: FOOD & BEVERAGE METAL CANS MARKET, BY APPLICATION, 2024–2029 (BILLION UNITS)
  • TABLE 331 AFRICA: FOOD & BEVERAGE METAL CANS MARKET, BY APPLICATION, 2020–2023 (USD BILLION)
  • TABLE 332 AFRICA: FOOD & BEVERAGE METAL CANS MARKET, BY APPLICATION, 2024–2029 (USD BILLION)
  • TABLE 333 AFRICA: FOOD & BEVERAGE METAL CANS MARKET, BY APPLICATION, 2020–2023 (BILLION UNITS)
  • TABLE 334 AFRICA: FOOD & BEVERAGE METAL CANS MARKET, BY APPLICATION, 2024–2029 (BILLION UNITS)
  • TABLE 335 STRATEGIES ADOPTED BY KEY PLAYERS IN FOOD & BEVERAGE METAL CANS MARKET
  • TABLE 336 FOOD & BEVERAGE METAL CANS MARKET: INTENSITY OF COMPETITIVE RIVALRY (CONSOLIDATED)
  • TABLE 337 FOOD & BEVERAGE METAL CANS MARKET: REGION FOOTPRINT
  • TABLE 338 FOOD & BEVERAGE METAL CANS MARKET: TYPE FOOTPRINT
  • TABLE 339 FOOD & BEVERAGE METAL CANS MARKET: APPLICATION FOOTPRINT
  • TABLE 340 FOOD & BEVERAGE METAL CANS MARKET: KEY STARTUPS/SMES
  • TABLE 341 FOOD & BEVERAGE METAL CANS MARKET: COMPETITIVE BENCHMARKING OF KEY STARTUPS/SMES, 2023
  • TABLE 342 FOOD & BEVERAGE METAL CANS MARKET: PRODUCT LAUNCHES, JANUARY 2020–AUGUST 2024
  • TABLE 343 FOOD & BEVERAGE METAL CANS MARKET: DEALS, JANUARY 2020–AUGUST 2024
  • TABLE 344 FOOD & BEVERAGE METAL CANS MARKET: EXPANSIONS, JANUARY 2020–AUGUST 2024
  • TABLE 345 FOOD & BEVERAGE METAL CANS MARKET: OTHER DEVELOPMENTS, JANUARY 2020–AUGUST 2024
  • TABLE 346 CROWN HOLDINGS, INC.: COMPANY OVERVIEW
  • TABLE 347 CROWN HOLDINGS, INC.: PRODUCTS/SOLUTIONS/SERVICES OFFERED
  • TABLE 348 CROWN HOLDINGS, INC.: DEALS, JANUARY 2020–DECEMBER 2024
  • TABLE 349 CROWN HOLDINGS, INC.: EXPANSIONS, JANUARY 2020–DECEMBER 2024
  • TABLE 350 CROWN HOLDINGS, INC: OTHER DEVELOPMENTS, JANUARY 2020–DECEMBER 2024
  • TABLE 351 BALL CORPORATION: COMPANY OVERVIEW
  • TABLE 352 BALL CORPORATION: PRODUCTS/SOLUTIONS/SERVICES OFFERED
  • TABLE 353 BALL CORPORATION: PRODUCT LAUNCHES, JANUARY 2020–DECEMBER 2024
  • TABLE 354 BALL CORPORATION: DEALS, JANUARY 2020–DECEMBER 2024
  • TABLE 355 BALL CORPORATION: EXPANSIONS, JANUARY 2020–DECEMBER 2024
  • TABLE 356 ARDAGH GROUP: COMPANY OVERVIEW
  • TABLE 357 ARDAGH GROUP: PRODUCTS/SOLUTIONS/SERVICES OFFERED
  • TABLE 358 ARDAGH GROUP: DEALS, JANUARY 2020–DECEMBER 2024
  • TABLE 359 ARDAGH GROUP: EXPANSIONS, JANUARY 2020–DECEMBER 2024
  • TABLE 360 CANPACK GROUP: COMPANY OVERVIEW
  • TABLE 361 CANPACK GROUP: PRODUCTS/SOLUTIONS/SERVICES OFFERED
  • TABLE 362 CANPACK GROUP: DEALS, JANUARY 2020–DECEMBER 2024
  • TABLE 363 TOYO SEIKAN GROUP HOLDINGS, LTD.: COMPANY OVERVIEW
  • TABLE 364 TOYO SEIKAN GROUP HOLDINGS, LTD: PRODUCTS/SOLUTIONS/SERVICES OFFERED
  • TABLE 365 TOYO SEIKAN GROUP HOLDINGS, LTD: DEALS, JANUARY 2020–DECEMBER 2024
  • TABLE 366 TOYO SEIKAN GROUP HOLDINGS, LTD: EXPANSIONS, JANUARY 2020–DECEMBER 2024
  • TABLE 367 SILGAN HOLDINGS INC.: COMPANY OVERVIEW
  • TABLE 368 SILGAN HOLDINGS, INC: PRODUCTS/SOLUTIONS/SERVICES OFFERED
  • TABLE 369 SILGAN HOLDINGS INC.: DEALS, JANUARY 2020–DECEMBER 2024
  • TABLE 370 CPMC HOLDINGS LIMITED: COMPANY OVERVIEW
  • TABLE 371 CPMC HOLDINGS LIMITED: PRODUCTS/SOLUTIONS/SERVICES OFFERED
  • TABLE 372 CPMC HOLDINGS LIMITED: EXPANSIONS, JANUARY 2020–DECEMBER 2024
  • TABLE 373 CCL INDUSTRIES: COMPANY OVERVIEW
  • TABLE 374 CCL INDUSTRIES: PRODUCTS/SOLUTIONS/SERVICES OFFERED
  • TABLE 375 CCL INDUSTRIES: PRODUCT LAUNCHES, JANUARY 2020–DECEMBER 2024
  • TABLE 376 CCL INDUSTRIES: DEALS, JANUARY 2020–DECEMBER 2024
  • TABLE 377 SHETRON GROUP: COMPANY OVERVIEW
  • TABLE 378 SHETRON GROUP : PRODUCTS/SOLUTIONS/SERVICES OFFERED
  • TABLE 379 KIAN JOO GROUP: COMPANY OVERVIEW
  • TABLE 380 KIAN JOO GROUP: PRODUCTS/SOLUTIONS/SERVICES OFFERED
  • TABLE 381 KIAN JOO GROUP: DEALS, JANUARY 2020–DECEMBER 2024
  • TABLE 382 ENVASES: COMPANY OVERVIEW
  • TABLE 383 ENVASES: PRODUCTS/SOLUTIONS/SERVICES OFFERED
  • TABLE 384 ENVASES: PRODUCT LAUNCHES, JANUARY 2020–DECEMBER 2024
  • TABLE 385 ENVASES: DEALS, JANUARY 2020–DECEMBER 2024
  • TABLE 386 ENVASES: EXPANSIONS, JANUARY 2020–DECEMBER 2024
  • TABLE 387 UNIVERSAL CAN CORPORATION: COMPANY OVERVIEW
  • TABLE 388 UNIVERSAL CAN CORPORATION: PRODUCTS/SOLUTIONS/SERVICES OFFERED
  • TABLE 389 INDEPENDENT CAN COMPANY: COMPANY OVERVIEW
  • TABLE 390 INDEPENDENT CAN COMPANY: PRODUCTS/SOLUTIONS/SERVICES OFFERED
  • TABLE 391 VISY: COMPANY OVERVIEW
  • TABLE 392 VISY: PRODUCTS/SOLUTIONS/SERVICES OFFERED
  • TABLE 393 MAUSER PACKAGING SOLUTIONS: COMPANY OVERVIEW
  • TABLE 394 MAUSER PACKAGING SOLUTIONS: PRODUCTS/SOLUTIONS/SERVICES OFFERED
  • TABLE 395 MAUSER PACKAGING SOLUTIONS: DEALS, JANUARY 2020–DECEMBER 2024
  • TABLE 396 MAUSER PACKAGING SOLUTIONS: EXPANSIONS, JANUARY 2020–DECEMBER 2024
  • TABLE 397 P. WILKINSON CONTAINERS LTD.: COMPANY OVERVIEW
  • TABLE 398 P. WILKINSON CONTAINERS LTD.: PRODUCTS/SOLUTIONS/SERVICES OFFERED
  • TABLE 399 LAGEEN FOOD PACKAGING: COMPANY OVERVIEW
  • TABLE 400 LAGEEN FOOD PACKAGING: PRODUCTS/SOLUTIONS/SERVICES OFFERED
  • TABLE 401 MASSILLY HOLDING S.A.S: COMPANY OVERVIEW
  • TABLE 402 MASSILLY HOLDING S.A.S: PRODUCTS/SOLUTIONS/SERVICES OFFERED
  • TABLE 403 JAMESTRONG PACKAGING: COMPANY OVERVIEW
  • TABLE 404 JAMESTRONG PACKAGING: PRODUCTS/SOLUTIONS/SERVICES OFFERED
  • TABLE 405 KINGCAN HOLDINGS LIMITED: COMPANY OVERVIEW
  • TABLE 406 KINGCAN HOLDINGS LIMITED: PRODUCTS/SOLUTIONS/SERVICES OFFERED
  • TABLE 407 MÜLLER AND BAUER GMBH & CO. KG.: COMPANY OVERVIEW
  • TABLE 408 HINDUSTAN TIN WORKS LIMITED: COMPANY OVERVIEW
  • TABLE 409 VOBEV: COMPANY OVERVIEW
  • TABLE 410 SCAN HOLDINGS: COMPANY OVERVIEW
  • TABLE 411 ALNA PACKAGING CO. LTD.: COMPANY OVERVIEW
  • TABLE 412 ADJACENT MARKETS TO FOOD & BEVERAGE METAL CANS MARKET
  • TABLE 413 BEVERAGE PACKAGING MARKET, BY PACKAGING TYPE, 2015–2018 (USD BILLION)
  • TABLE 414 BEVERAGE PACKAGING MARKET, BY PACKAGING TYPE, 2019–2026 (USD BILLION)
  • TABLE 415 FRESH FOOD PACKAGING MARKET, BY APPLICATION, 2018–2025 (USD MILLION)
LIST OF FIGURES
 
  • FIGURE 1 MARKET SEGMENTATION
  • FIGURE 2 FOOD & BEVERAGE METAL CANS MARKET: RESEARCH DESIGN
  • FIGURE 3 BREAKDOWN OF INTERVIEWS WITH EXPERTS: BY COMPANY TYPE, DESIGNATION, AND REGION
  • FIGURE 4 FOOD & BEVERAGE METAL CANS MARKET SIZE ESTIMATION: TOP-DOWN APPROACH
  • FIGURE 5 FOOD & BEVERAGE METAL CANS MARKET SIZE CALCULATION: SUPPLY-SIDE ANALYSIS
  • FIGURE 6 FOOD & BEVERAGE METAL CANS MARKET SIZE ESTIMATION: BOTTOM-UP APPROACH
  • FIGURE 7 DATA TRIANGULATION
  • FIGURE 8 2-PIECE CANS SEGMENT TO LEAD MARKET DURING FORECAST PERIOD
  • FIGURE 9 ALUMINUM CANS SEGMENT TO LEAD MARKET DURING FORECAST PERIOD
  • FIGURE 10 BRIGHT COATING SEGMENT TO ACCOUNT FOR LARGER MARKET SHARE DURING FORECAST PERIOD
  • FIGURE 11 BEVERAGES SEGMENT TO LEAD MARKET DURING FORECAST PERIOD
  • FIGURE 12 ASIA PACIFIC TO BE FASTEST-GROWING REGION DURING FORECAST PERIOD
  • FIGURE 13 GROWING TREND OF RTD BEVERAGES TO SIGNIFICANTLY DRIVE DEMAND IN US AND EUROPE
  • FIGURE 14 US LARGEST CONSUMER IN NORTH AMERICA, DRIVEN BY HIGH DEMAND FOR SOFT DRINKS, ENERGY DRINKS, AND BEER
  • FIGURE 15 US ESTIMATED TO ACCOUNT FOR LARGEST SHARE (BY VALUE) IN 2024
  • FIGURE 16 2-PIECE FOOD & BEVERAGE METAL CANS SEGMENT TO ACCOUNT FOR LARGER MARKET SHARE DURING FORECAST PERIOD
  • FIGURE 17 ALUMINUM SEGMENT ESTIMATED TO DOMINATE MARKET IN 2024
  • FIGURE 18 BRIGHT COATING SEGMENT ESTIMATED TO ACCOUNT FOR LARGER MARKET SHARE IN 2024
  • FIGURE 19 BEVERAGES SEGMENT TO LEAD MARKET DURING FORECAST PERIOD
  • FIGURE 20 ALUMINUM PRICE HISTORY
  • FIGURE 21 FOOD & BEVERAGE METAL CANS MARKET: DRIVERS, RESTRAINTS, OPPORTUNITIES, AND CHALLENGES
  • FIGURE 22 ADOPTION OF GEN AI IN FOOD & BEVERAGE METAL CANS MARKET
  • FIGURE 23 FOOD & BEVERAGE METAL CANS MARKET: SUPPLY CHAIN ANALYSIS
  • FIGURE 24 FOOD & BEVERAGE METAL CANS MARKET: VALUE CHAIN ANALYSIS
  • FIGURE 25 AVERAGE SELLING PRICE TREND OF METAL CANS OF KEY PLAYERS, BY COATING TYPE, 2023 (USD/UNIT)
  • FIGURE 26 AVERAGE SELLING PRICE TREND, BY MATERIAL TYPE, 2020–2023 (USD/UNIT)
  • FIGURE 27 AVERAGE SELLING PRICE TREND, BY REGION, 2020–2023 (USD/UNIT)
  • FIGURE 28 KEY PLAYERS IN FOOD & BEVERAGE METAL CANS ECOSYSTEM
  • FIGURE 29 TRENDS/DISRUPTIONS IMPACTING CUSTOMER BUSINESS
  • FIGURE 30 NUMBER OF PATENTS GRANTED BETWEEN 2014 AND 2024
  • FIGURE 31 REGIONAL ANALYSIS OF PATENTS GRANTED FOR FOOD & BEVERAGE METAL CANS MARKET, 2014–2024
  • FIGURE 32 PORTER’S FIVE FORCES ANALYSIS: FOOD & BEVERAGE METAL CANS MARKET
  • FIGURE 33 INFLUENCE OF STAKEHOLDERS ON BUYING METAL CANS FOR DIFFERENT APPLICATIONS
  • FIGURE 34 KEY BUYING CRITERIA FOR TOP METAL CAN APPLICATIONS
  • FIGURE 35 2-PIECE CANS SEGMENT TO LEAD MARKET DURING FORECAST PERIOD
  • FIGURE 36 ALUMINUM SEGMENT TO ACCOUNT FOR LARGER MARKET SHARE DURING FORECAST PERIOD
  • FIGURE 37 ALUMINUM: FOOD & BEVERAGE METAL CANS MARKET BY SUBSEGMENT, 2023 (VALUE)
  • FIGURE 38 BRIGHT COATING SEGMENT TO DOMINATE MARKET DURING FORECAST PERIOD
  • FIGURE 39 BEVERAGES SEGMENT TO LEAD MARKET DURING FORECAST PERIOD
  • FIGURE 40 330 ML CAN CAPACITY SEGMENT TO DOMINATE MARKET DURING FORECAST PERIOD
  • FIGURE 41 CHINA PROJECTED TO RECORD HIGHEST CAGR IN FOOD & BEVERAGE METAL CANS MARKET DURING FORECAST PERIOD
  • FIGURE 42 NORTH AMERICA: FOOD & BEVERAGE METAL CANS MARKET SNAPSHOT
  • FIGURE 43 ASIA PACIFIC: FOOD & BEVERAGE METAL CANS MARKET SNAPSHOT
  • FIGURE 44 REVENUE ANALYSIS OF KEY MARKET PLAYERS, 2019–2023 (USD BILLION)
  • FIGURE 45 ANNUAL REVENUE, 2023 (USD BILLION) VS. REVENUE GROWTH, 2021–2023
  • FIGURE 46 EBITDA, 2023 (USD BILLION)
  • FIGURE 47 FOOD & BEVERAGE METAL CANS MARKET: GLOBAL SNAPSHOT OF KEY PARTICIPANTS, 2023
  • FIGURE 48 BRAND/PRODUCT COMPARATIVE ANALYSIS, BY KEY TYPE OF FOOD & BEVERAGE METAL CANS MARKET
  • FIGURE 49 COMPANY EVALUATION MATRIX: KEY PLAYERS, 2023
  • FIGURE 50 FOOD & BEVERAGE METAL CANS MARKET: COMPANY FOOTPRINT
  • FIGURE 51 COMPANY EVALUATION MATRIX: STARTUPS/SMES, 2023
  • FIGURE 52 CROWN HOLDINGS, INC.: COMPANY SNAPSHOT
  • FIGURE 53 BALL CORPORATION: COMPANY SNAPSHOT
  • FIGURE 54 ARDAGH GROUP: COMPANY SNAPSHOT
  • FIGURE 55 TOYO SEIKAN GROUP HOLDINGS, LTD.: COMPANY SNAPSHOT
  • FIGURE 56 SILGAN HOLDINGS INC.: COMPANY SNAPSHOT
  • FIGURE 57 CPMC HOLDINGS LIMITED: COMPANY SNAPSHOT
  • FIGURE 58 CCL INDUSTRIES: COMPANY SNAPSHOT
  • FIGURE 59 SHETRON GROUP: COMPANY SNAPSHOT
  • FIGURE 60 KIAN JOO GROUP: COMPANY SNAPSHOT

The research study involved extensive secondary sources, directories, and databases such as Bloomberg Businessweek and Factiva to identify and collect information useful for a technical, market-oriented, and commercial study of the food and beverage metal cans market. In-depth interviews were conducted with various primary respondents—such as key industry participants, subject matter experts (SMEs), C-level executives of key market players, and industry consultants—to obtain and verify critical qualitative and quantitative information and assess prospects.

Secondary Research

The secondary sources referred for this research study include government sources, such as the Food and Agriculture Organization (FAO), the Can Manufacturers India (CMI), Eurostat (EU Database), and various national ministries of the agricultural department, corporate filings (such as annual reports, press releases, investor presentations, and financial statements), and trade, business, and professional associations such as In the secondary research process, various organizations such as The Aluminium Association, Metal Construction Association, and Metal Packaging Europe (MPE), were referred to identify and collect information for this study.

Secondary research was mainly used to obtain key information about the industry's supply chain—the total pool of key players, market classification, and segmentation according to the industry trends and key developments from market-oriented perspectives.

Primary Research

The food and beverage metal cans market comprises several stakeholders, including raw material suppliers, end-product manufacturers, and regulatory organizations in the supply chain. Various primary sources from both the supply and demand sides of the market were interviewed to obtain qualitative and quantitative information. Primary interviewees from the supply side include research institutions involved in R&D to introduce technology, distributors, wholesalers, importers & exporters of aluminium/steel manufacturers and technology providers. Primary sources from the demand-side include key opinion leaders, executives, vice presidents, and CEOs through questionnaires, emails, and telephonic interviews.

Food and Beverage Metal Cans Market Primary Respondents

Note: Three tiers of the companies are defined based on their total revenues in 2022 or 2023, according to the availability of financial data.
Tier 1: Revenue > USD 1 billion
Tier 2: USD 100 million = Revenue = USD 1 billion
Tier 3: Revenue < USD 100 million

To know about the assumptions considered for the study, download the pdf brochure

Market Size Estimation

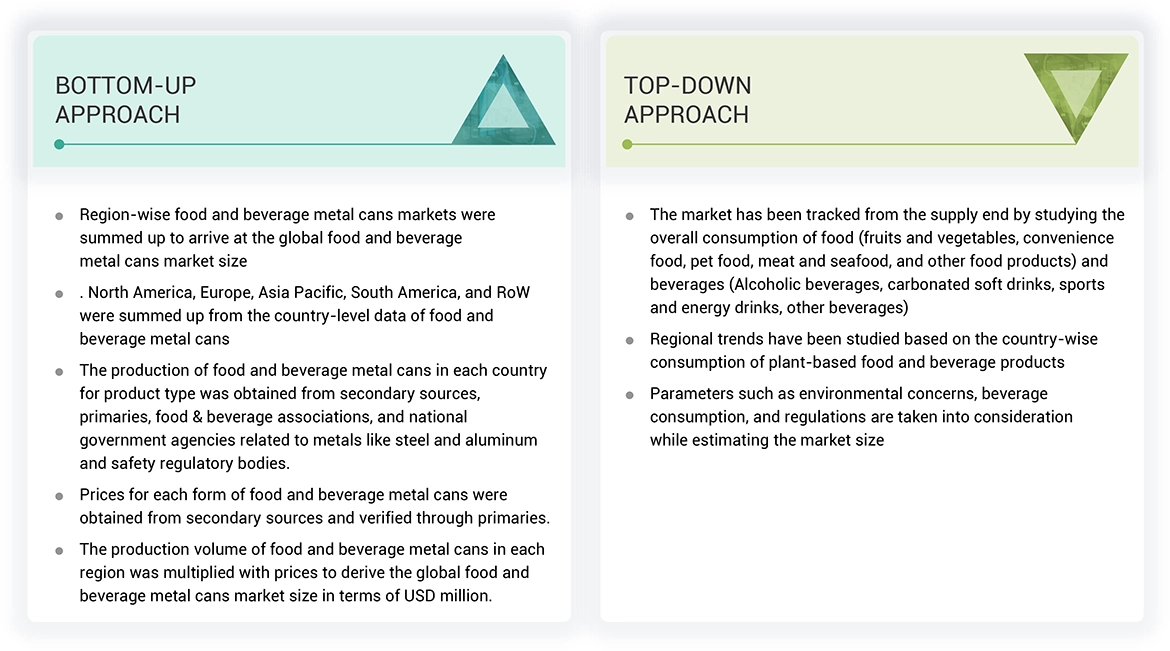
Both the top-down and bottom-up approaches have been used to estimate and validate the total size of the food and beverage metal cans market. These approaches were extensive to determine the size of the subsegments in the market. The research methodology used to estimate the market size includes the following details:

Food and Beverage Metal Cans Market : Top-Down and Bottom-Up Approach

Food and Beverage Metal Cans Market Top Down and Bottom Up Approach

Data Triangulation

After arriving at the overall market size from the estimation process explained above, the total market was split into several segments and subsegments. The data triangulation and market breakdown procedures were employed, wherever applicable, to estimate the overall food and beverage metal cans market and arrive at the exact statistics for all segments and subsegments. The data was triangulated by studying various factors and trends from the demand and supply sides. Along with this, the market size was validated using both the top-down and bottom-up approaches.

Market Definition

The food and beverage metal cans market refers to the global industry involved in the production, distribution, and utilization of metal cans, primarily made from aluminum or steel, for packaging food and beverages. These cans are widely used for preserving a range of products, including soft drinks, beer, fruit juices, energy drinks, canned vegetables, soups, and ready-to-eat meals.

Key characteristics of metal cans in this market include their durability, ability to protect the contents from contamination, extend shelf life, and support recycling initiatives, which align with sustainability goals. The demand for metal cans is driven by factors such as their lightweight, corrosion-resistant properties, and consumer preference for eco-friendly packaging solutions, along with their ability to be fully recycled without loss of quality. The market encompasses manufacturers of metal cans, suppliers of raw materials (like aluminum and steel), end-user industries (food and beverage companies), and consumers.

Stakeholders

  • Food manufacturers
  • Aluminum can manufacturers
  • Steel can manufacturers
  • Fruit and Vegetable manufacturers
  • Food importers and exporters
  • Intermediary suppliers include traders and distributors of packed foods such as pet food and convenience foods.
  • Government and research organizations
  • Associations and industry bodies:
    • Food and Agriculture Organization (FAO)
    • United States Department of Agriculture (USDA)
    • European Food Safety Authority (EFSA)
    • European Association of Specialty Feed Ingredients and their Mixtures (FEFANA)
    • Organization for Economic Co-operation and Development (OECD)
  • Venture capitalists and investors

Report Objectives

  • To determine and project the size of the food and beverage metal cans market by fabrication type, application, degree of internal pressure, coating type, material type, beverage can capacity, and region over five years, ranging from 2024 to 2029.
  • To analyze opportunities for stakeholders by identifying the high-growth segments of the food and beverage metal cans market
  • To forecast the size of the market segments with respect to five main regions: North America, Europe, Asia Pacific, the Middle East & Africa, and Latin America
  • To analyze subsegments of the food and beverage metal cans market with respect to individual growth trends, prospects, and contributions to the overall market
  • To profile the key players and comprehensively analyze their market sizes and core competencies
  • To track and analyze competitive developments such as product enhancements and new product launches, acquisitions, and partnerships & collaborations in the food and beverage metal cans market globally

Available Customizations

With the given market data, MarketsandMarkets offers customizations according to company-specific scientific needs.

The following customization options are available for the report:

PRODUCT ANALYSIS

  • Product Matrix, which gives a detailed comparison of the product portfolio of each company.

GEOGRAPHIC ANALYSIS

With the given market data, MarketsandMarkets offers customizations according to company-specific scientific needs.

  • Further breakdown of the Rest of the European food and beverage metal cans market, by key country
  • Further breakdown of the Rest of the South American food and beverage metal cans market market, by key country
  • Further breakdown of the Rest of Asia Pacific food and beverage metal cans market market, by key country

COMPANY INFORMATION

  • Detailed analyses and profiling of additional market players

Previous Versions of this Report

Food & Beverage Metal Cans Market by Material (Aluminum and Steel), Type (2-Piece and 3-Piece), Degree of Internal Pressure (Pressurized Cans and Vacuum Cans), Application (Food and Beverages), and Region - Global Forecast to 2028

Report Code FB 2722
Published in Jun, 2023, By MarketsandMarkets™

Food & Beverage Metal Cans Market by Material (Aluminum and Steel), Type (2-Piece and 3-Piece), Degree of Internal Pressure (Pressurized Cans and Vacuum Cans), Application (Food and Beverages), and Region - Global Forecast to 2025

Report Code FB 2722
Published in Mar, 2020, By MarketsandMarkets™

Food & Beverage Metal Cans Market by Type (2-piece, 3-piece), Material (Aluminum, Steel), Application (Beverages (Alcoholic, CSD, Sports & Energy Drinks), and Food (Fruits & Vegetables, Convenience Food, Pet Food, Meat & Seafood)) - Global Forecast to 2022

Report Code FB 2722
Published in Oct, 2016, By MarketsandMarkets™

Food & Beverage Metal Cans Market by Application [Beverages (Alcoholic, CSD, Sports & Energy Drinks, Others), Food (Fruit & Vegetable, Convenience Food, Pet Food, Meat & Seafood)], by Material (Aluminum & Steel) - Global Forecast to 2019

Report Code FB 2722
Published in Aug, 2014, By MarketsandMarkets™

Food & Beverage Metal Cans Market by Application [Beverages (Alcoholic, CSD, Sports & Energy Drinks, Others), Food (Fruit & Vegetable, Convenience Food, Pet Food, Meat & Seafood)], by Material (Aluminum & Steel) - Global Forecast to 2019

Report Code FB 2722
Published in Jan, 2011, By MarketsandMarkets™

Custom Market Research Services

We Will Customise The Research For You, In Case The Report Listed Above Does Not Meet With Your Requirements

Get 10% Free Customisation

Growth opportunities and latent adjacency in Food and Beverage Metal Cans Market

Charlotte

May, 2022

what are the different types of metals used for canned food packaging?.

DMCA.com Protection Status