In-Vitro Diagnostic (IVD) Market (Applications, End-users & Types) Trends & Global Forecasts (Major & Emerging Markets � G7, Japan & BRIC) (2011 - 2016)


Please click here to get the relevant report of In-Vitro Diagnostics (IVD) Market (Clinical Chemistry, Immunoassays, Molecular Diagnostics, Hematology Analyzers & Microbiology Culture) � Global Trends & Forecasts to 2016
The global IVD market was valued at $44 billion in the year 2011, growing at a CAGR of 7.8% from 2011 to 2016. The U.S. represented the biggest market for the IVD equipments accounting for a share of 47% of the total IVD market in the year 2011.
The European region accounted for 31% of the global IVD market with Germany accounting for the largest share of 23.24% followed France (16.89%) and Italy (16.41%) of the total IVD market.
The Asian region is expected to be ruled by the emerging economies such as China and India, show the highest CAGR by the year 2016. The Chinese IVD market is taking frog leap amongst the emerging nations, followed by India, Russia, and Brazil. The major driving factor for the IVD industry to boom in the emerging countries is the government funding and improved healthcare facilities.
However, the condition is completely reverse in the developed countries such as North America and Eu-5 as these countries are facing major financial crisis and thus having deep cuts on the healthcare budgets with limited reimbursements provided on the clinical testing and the newly introduced tests in the market thus hampering the growth of IVD industry.
The major factors driving the growth of the IVD market is increased patient awareness, patient self testing, and increasing baby booming population across the globe. Advancement in the technology bringing more of automated tests is also one of the major drivers for the growth of IVD market.
Other major drivers for the growth of the IVD industry is rise in the number of diseases like respiratory infections, hospital acquired infections, and sexually transmitted diseases. Similarly rise in the chronic diseases such as diabetes, hypertension, cardiovascular diseases, and cancer are driving the overall IVD market.
Analyzers are the main instruments used for conducting the tests. The instruments account only major share of the market share of the IVD market, by types. The analyzers are of 3-types namely, high through put analyzers, medium throughput analyzers, and low throughput analyzers.
Molecular diagnostics is the largest growing segment of the global IVD market with a highest CAGR for year 2011 to 2016.
Budget constraints causing and unfavorable reimbursement scenario for tests especially for severe conditions like cancer are prime reasons for slow growth in the U.S., and Canadian market.
However, the condition is reverse in the Latin American countries like Brazil and Mexico. There has been huge funding from the Brazilian government and the public sector with increased efforts being taken to prevent infectious diseases in the country by conducting all the preventive tests.
Similarly, Asia is the fastest growing region of the global market and accounts to be 22.88% of the global market and is estimated to reach the market of $17.20 billion with a CAGR 11.3% from 2011 to 2016. China is the fastest growing market within Asia and is growing at a CAGR of 18.8% to reach the market of $1.24 billion by 2016. Chinese health Reform During the year, the initial phases of the three-year (2009-2011) made significant headway in increasing insurance coverage of some kind (now >93% of the total population) and improving grass roots and primary care health system.
The major players in the IVD market are Roche Diagnostics (Germany), Abbott Diagnostics (U.S.), Beckman Coulter (U.S.), BD Diagnostics (U.S.), and Siemens Diagnostics (Germany).
Scope of Report
The In-Vitro Diagnostic Market research report evaluates the IVD market globally with respect to the revenue, growth, and industry focus in the following markets:
Global IVD market, by applications:
- Molecular diagnostics
- Immunoassays
- Clinical chemistry
- Microbiology
- Hematology
- Others (Flow cytometry, nephelometry, coagulation, advanced lipid testing, etc.)
Global IVD market, by types:
- Analyzers
- Reagents
- Services
Global IVD market, by end-users:
- Patient self testing
- Laboratories (Commercial labs & physician�s office labs)
- Hospitals
- Universities
- Ambulatory care
Global IVD market, by geography:
- Americas
- U.S.
- Canada
- Brazil
- Mexico
- Rest of the America
- Europe
- U.K.
- Germany
- France
- Italy
- Spain
- Russia
- Rest of Europe
- Asia
- India
- China
- Japan
- Rest of Asia
- ROW
The global IVD market was valued at $44 billion in the year 2011, growing at a CAGR of 7.8% from 2011 to 2016. The U.S. represented the biggest market for the IVD equipments accounting for a share of 47% of the total IVD market in the year 2011.
The European region accounted for 31% of the global IVD market with Germany accounting for the largest share of 23.24% followed France (16.89%) and Italy (16.41%) of the total IVD market.
Asia is ruled by the emerging economies like India and China. China is the largest growing market of Asia with a highest CAGR of 18.8%. Advancement in technology and growing ageing population, with an increase in middle class population is the major drivers for the growth of Asian market. The total IVD market of Asia is $10 billion in 2011 and is estimated to reach the market of $17.2 billion by 2016.
However, the condition is completely reverse in the developed countries such as North America and Eu-5 as these countries are facing major financial crisis and thus having deep cuts on the healthcare budgets with limited reimbursements provided on the clinical testing and the newly introduced tests in the market thus hampering the growth of IVD industry.
The laboratory testing market accounts for the highest market by end-user segmentation with a share of 73% with a market of $35.52 billion for the year 2011 and is expected to reach the market of $45.54 billion by the year 2016 with a CAGR of 6.9%.
The major factors driving the growth of the IVD market is increased patient awareness, patient self testing, and increasing baby booming population across the globe. Advancement in the technology bringing more of automated tests is also one of the major drivers for the growth of IVD market.
The major players in the IVD market are Roche Diagnostics (Germany), Abbott Diagnostics (U.S.), Beckman Coulter (U.S.), BD Diagnostics (U.S.), and Siemens Diagnostics (Germany).
Market Dynamics for Global In-Vitro Diagnostic (IVD) Market
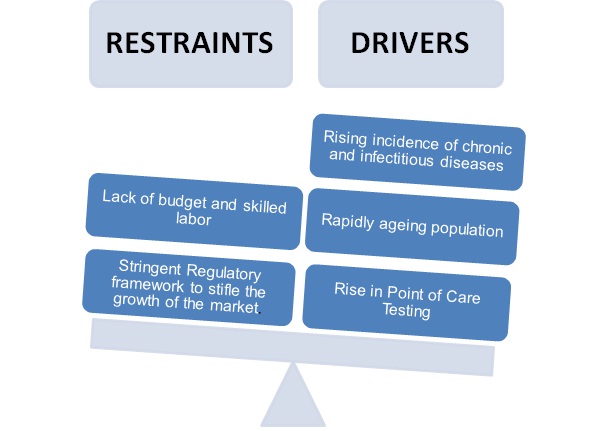
TABLE OF CONTENTS
1 INTRODUCTION
1.1 KEY TAKE-AWAYS
1.2 REPORT DESCRIPTION
1.3 MARKETS COVERED
1.4 STAKEHOLDERS
1.5 RESEARCH METHODOLOGY
1.5.1 MARKET SIZE
1.5.2 MARKET SHARE
1.5.3 KEY DATA POINTS FROM SECONDARY SOURCE
1.5.4 KEY DATA POINTS FROM PRIMARY SOURCE
2 EXECUTIVE SUMMARY
3 MARKET OVERVIEW
3.1 INTRODUCTION
3.2 MARKET SEGMENTATION
3.3 BURNING ISSUE
3.3.1 LAB AUTOMATION FOR INCREASED EFFICIENCY & ACCURATE DIAGNOSIS
3.4 WINNING IMPERATIVE
3.4.1 NON PROPRIETARY SYSTEM WITH ENHANCED FUNCTIONALITIES
3.5 MARKET DYNAMICS
3.5.1 DRIVERS
3.5.1.1 Rising incidence of chronic and infectious diseases in emerging economies to drive the market
3.5.1.2 Rapidly aging population
3.5.1.3 Rise in Point-of-Care testing
3.5.1.4 Personalized medicine to propel growth of the IVD market
3.5.2 RESTRAINTS
3.5.2.1 Lack of budget and labor
3.5.2.2 Stringent regulatory framework to stifle the growth of IVD market
3.6 MARKET SHARE ANALYSIS
3.7 IVD MARKET, BY END-USERS
3.8 IVD MARKET, BY TYPES
4 CLINICAL CHEMISTRY
4.1 OVERVIEW
4.1.1 GENERAL CHEMISTRY
4.1.2 URINE CHEMISTRY ANALYZERS
4.1.3 BLOOD GAS ELECTROLYTE ANALYZERS
4.1.4 URINE CYTOLOGY
4.1.5 CERVICAL CYTOLOGY
5 IMMUNOASSAYS
5.1 OVERVIEW
5.1.1 INFECTIOUS DISEASES
5.1.2 ONCOLOGY
5.1.3 CARDIAC
5.1.4 BLOOD SCREENING
5.1.5 ENDOCRINE
5.1.6 DIABETES
5.1.7 OTHERS
6 MOLECULAR DIAGNOSTICS
6.1 OVERVIEW
6.1.1 INFECTIOUS DISEASES
6.1.2 ONCOLOGY
6.1.3 GENETIC
6.1.4 BLOOD SCREENING
6.1.5 OTHERS
7 HEMATOLOGY
7.1 OVERVIEW
7.1.1 HIGH THROUGHPUT ANALYZER
7.1.2 MEDIUM THROUGHPUT ANALYZER
7.1.3 LOW THROUGHPUT ANALYZER
8 MICROBIOLOGY
8.1 OVERVIEW
8.1.1 BLOOD CULTURE
8.1.2 PATHOLOGICAL CULTURE
8.1.3 IDENTIFICATION & ANTIBIOTIC SUSCEPTIBILITY TESTING
8.1.4 OTHERS
9 OTHERS
9.1 OVERVIEW
10 GEOGRAPHICAL ANALYSIS
10.1 INTRODUCTION
10.2 AMERICAS
10.2.1 U.S.
10.2.2 CANADA
10.2.3 BRAZIL
10.2.4 MEXICO
10.2.5 REST OF AMERICAS
10.3 EUROPE
10.3.1 U.K.
10.3.2 GERMANY
10.3.3 FRANCE
10.3.4 ITALY
10.3.5 SPAIN
10.3.6 RUSSIA
10.3.7 REST OF EUROPE
10.4 ASIA
10.4.1 JAPAN
10.4.2 CHINA
10.4.3 INDIA
10.4.4 REST OF ASIA
10.5 REST OF THE WORLD
11 COMPETITIVE LANDSCAPE
11.1 INTRODUCTION
11.2 NEW PRODUCTS DEVELOPMENT
11.3 EXPANSIONS
11.4 AGREEMENTS & COLLABORATIONS
11.5 MERGERS & ACQUISITIONS
12 COMPANY PROFILES
12.1 ABBOTT DIAGNOSTICS INC
12.1.1 OVERVIEW
12.1.2 FINANCIALS
12.1.3 PRODUCTS & SERVICES
12.1.4 STRATEGY
12.1.5 DEVELOPMENTS
12.2 ALERE INC
12.2.1 OVERVIEW
12.2.2 FINANCIALS
12.2.3 PRODUCTS & SERVICES
12.2.4 STRATEGY
12.2.5 DEVELOPMENTS
12.3 ARKRAY INC
12.3.1 OVERVIEW
12.3.2 PRODUCTS & SERVICES
12.3.3 STRATEGY
12.3.4 DEVELOPMENTS
12.4 BECKMAN COULTER INC
12.4.1 OVERVIEW
12.4.2 FINANCIALS
12.4.3 PRODUCTS & SERVICES
12.4.4 STRATEGY
12.4.5 DEVELOPMENTS
12.5 BECTON, DICKINSON AND COMPANY
12.5.1 OVERVIEW
12.5.2 FINANCIALS
12.5.3 PRODUCTS & SERVICES
12.5.4 STRATEGY
12.5.5 DEVELOPMENTS
12.6 BIOMERIEUX
12.6.1 OVERVIEW
12.6.2 FINANCIALS
12.6.3 PRODUCTS & SERVICES
12.6.4 STRATEGY
12.6.5 DEVELOPMENTS
12.7 BIO-RAD LABORATORIES INC
12.7.1 OVERVIEW
12.7.2 FINANCIALS
12.7.3 PRODUCTS & SERVICES
12.7.4 STRATEGY
12.7.5 DEVELOPMENTS
12.8 DIASORIN DIAGNOSTIC S.P.A.
12.8.1 OVERVIEW
12.8.2 FINANCIALS
12.8.3 PRODUCTS & SERVICES
12.8.4 STRATEGY
12.8.5 DEVELOPMENTS
12.9 DIAGNOSTICA STAGO SAS
12.9.1 OVERVIEW
12.9.2 FINANCIALS
12.9.3 PRODUCTS & SERVICES
12.9.4 STRATEGY
12.9.5 DEVELOPMENTS
12.10 GEN-PROBE INCORPORATED
12.10.1 OVERVIEW
12.10.2 FINANCIALS
12.10.3 PRODUCTS & SERVICES
12.10.4 STRATEGY
12.10.5 DEVELOPMENTS
12.11 HOLOGIC INC
12.11.1 OVERVIEW
12.11.2 FINANCIALS
12.11.3 PRODUCTS & SERVICES
12.11.4 STRATEGY
12.11.5 DEVELOPMENTS
12.12 HORIBA LTD
12.12.1 OVERVIEW
12.12.2 FINANCIALS
12.12.3 PRODUCTS & SERVICES
12.12.4 STRATEGY
12.12.5 DEVELOPMENTS
12.13 LUMINEX CORPORATION
12.13.1 OVERVIEW
12.13.2 FINANCIALS
12.13.3 PRODUCTS & SERVICES
12.13.4 STRATEGY
12.13.5 DEVELOPMENTS
12.14 MINDRAY MEDICAL INTERNATIONAL LIMITED
12.14.1 OVERVIEW
12.14.2 FINANCIALS
12.14.3 PRODUCTS & SERVICES
12.14.4 STRATEGY
12.14.5 DEVELOPMENTS
12.15 NOVARTIS INTERNATIONAL AG
12.15.1 OVERVIEW
12.15.2 FINANCIALS
12.15.3 PRODUCTS & SERVICES
12.15.4 STRATEGY
12.15.5 DEVELOPMENTS
12.16 ORTHO CLINICAL DIAGNOSTICS (JNJ COMPANY)
12.16.1 OVERVIEW
12.16.2 FINANCIALS
12.16.3 PRODUCTS & SERVICES
12.16.4 STRATEGY
12.16.5 DEVELOPMENTS
12.17 QIAGEN N.V.
12.17.1 OVERVIEW
12.17.2 FINANCIALS
12.17.3 PRODUCTS & SERVICES
12.17.4 STRATEGY
12.17.5 DEVELOPMENTS
12.18 ROCHE DIAGNOSTICS LIMITED
12.18.1 OVERVIEW
12.18.2 FINANCIALS
12.18.3 PRODUCTS & SERVICES
12.18.4 STRATEGY
12.18.5 DEVELOPMENTS
12.19 SIEMENS HEALTHCARE
12.19.1 OVERVIEW
12.19.2 FINANCIALS
12.19.3 PRODUCTS & SERVICES
12.19.4 STRATEGY
12.19.5 DEVELOPMENTS
12.20 SYSMEX CORPORATION
12.20.1 OVERVIEW
12.20.2 FINANCIALS
12.20.3 PRODUCTS & SERVICES
12.20.4 STRATEGY
12.20.5 DEVELOPMENTS
12.21 THERMO FISHER SCIENTIFIC INC
12.21.1 OVERVIEW
12.21.2 FINANCIALS
12.21.3 PRODUCTS & SERVICES
12.21.4 STRATEGY
12.21.5 DEVELOPMENTS
LIST OF TABLES
TABLE 1 GLOBAL IVD MARKET REVENUE, BY APPLICATIONS, 2009 � 2016 ($BILLION)
TABLE 2 GLOBAL CLINICAL CHEMISTRY MARKET REVENUE, BY APPLICATIONS, 2009 � 2016 ($BILLION)
TABLE 3 GLOBAL CLINICAL CHEMISTRY MARKET REVENUE, BY GEOGRAPHY, 2009 � 2016 ($BILLION)
TABLE 4 CLINICAL CONDITIONS & TESTS CONDUCTED
TABLE 5 GLOBAL IMMUNOASSAYS MARKET REVENUE, BY APPLICATIONS, 2009 � 2016 ($BILLION)
TABLE 6 GLOBAL IMMUNOASSAYS MARKET REVENUE, BY GEOGRAPHY, 2009 � 2016 ($BILLION)
TABLE 7 GLOBAL MOLECULAR DIAGNOSTICS MARKET REVENUE, BY APPLICATIONS, 2009 � 2016 ($BILLION)
TABLE 8 MOLECULAR DIAGNOSTICS MARKET REVENUE, BY GEOGRAPHY, 2009 � 2016 ($BILLION)
TABLE 9 GLOBAL HEMATOLOGY MARKET REVENUE, BY APPLICATIONS, 2009 � 2011 ($BILLION)
TABLE 10 GLOBAL HEMATOLOGY MARKET REVENUE, BY GEOGRAPHY, 2009 � 2016 ($BILLION)
TABLE 11 GLOBAL MICROBIOLOGY MARKET REVENUE, BY APPLICATIONS, 2009 � 2016 ($BILLION)
TABLE 12 GLOBAL MICROBIOLOGY MARKET REVENUE, BY GEOGRAPHY, 2009 � 2016 ($BILLION)
TABLE 13 GLOBAL OTHERS MARKET REVENUE, BY APPLICATIONS, 2009 � 2016 ($BILLION)
TABLE 14 GLOBAL OTHERS MARKET REVENUE, BY GEOGRAPHY, 2009 � 2016 ($BILLION)
TABLE 15 IVD MARKET REVENUE, BY GEOGRAPHY, 2009 � 2016 ($BILLION)
TABLE 16 AMERICAS: IVD MARKET REVENUE, BY COUNTRY, 2009 � 2016 ($BILLION)
TABLE 17 AMERICAS: IVD MARKET REVENUE, BY APPLICATIONS, 2009 � 2016 ($BILLION)
TABLE 18 AMERICAS: CLINICAL CHEMISTRY MARKET REVENUE, BY COUNTRY, 2009 � 2016 ($BILLION)
TABLE 19 AMERICAS: IMMUNOASSAYS MARKET REVENUE, BY COUNTRY, 2009 � 2016 ($BILLION)
TABLE 20 AMERICAS: MOLECULAR DIAGNOSTICS MARKET REVENUE, BY COUNTRY, 2009 � 2016 ($BILLION)
TABLE 21 AMERICAS: HEMATOLOGY MARKET REVENUE, BY COUNTRY, 2009 � 2016 ($BILLION)
TABLE 22 AMERICAS: MICROBIOLOGY MARKET REVENUE, BY COUNTRY, 2009 � 2016 ($BILLION)
TABLE 23 AMERICAS: OTHERS MARKET REVENUE, BY COUNTRY, 2009 � 2016 ($BILLION)
TABLE 24 AMERICAS: IVD MARKET REVENUE, BY END-USERS, 2009 � 2016 ($BILLION)
TABLE 25 U.S.: IVD MARKET REVENUE, BY APPLICATIONS, 2009 � 2016 ($BILLION)
TABLE 26 CANADA: IVD MARKET REVENUE, BY APPLICATIONS, 2009 � 2016 ($BILLION)
TABLE 27 BRAZIL: IVD MARKET REVENUE, BY APPLICATIONS, 2009 � 2016 ($BILLION)
TABLE 28 MEXICO: IVD MARKET REVENUE, BY APPLICATIONS, 2009 � 2016 ($BILLION)
TABLE 29 EUROPE: IVD MARKET REVENUE, BY COUNTRY, 2009 � 2016 ($BILLION)
TABLE 30 EUROPE: IVD MARKET REVENUE, BY APPLICATIONS, 2009 � 2016 ($BILLION)
TABLE 31 EUROPE: CLINICAL CHEMISTRY MARKET REVENUE, BY COUNTRY, 2009 � 2016 ($BILLION)
TABLE 32 EUROPE: IMMUNOASSAYS MARKET REVENUE, BY COUNTRY, 2009 � 2016 ($BILLION)
TABLE 33 EUROPE: MOLECULAR DIAGNOSTICS MARKET REVENUE, BY COUNTRY, 2009 � 2016 ($MILLION)
TABLE 34 EUROPE: HEMATOLOGY MARKET REVENUE, BY COUNTRY, 2009 � 2016 ($BILLION)
TABLE 35 EUROPE: MICROBIOLOGY MARKET REVENUE, BY COUNTRY, 2009 � 2016 ($BILLION)
TABLE 36 EUROPE: OTHERS MARKET REVENUE, BY COUNTRY, 2009 � 2016 ($BILLION)
TABLE 37 EUROPE: IVD MARKET REVENUE, BY END-USERS, 2009 � 2016 ($BILLION)
TABLE 38 U.K.: IVD MARKET REVENUE, BY APPLICATIONS, 2009 � 2016 ($BILLION)
TABLE 39 GERMANY: IVD MARKET REVENUE, BY APPLICATIONS, 2009 � 2016 ($BILLION)
TABLE 40 FRANCE: IVD MARKET REVENUE, BY APPLICATIONS, 2009 � 2016 ($BILLION)
TABLE 41 ITALY: IVD MARKET REVENUE, BY APPLICATIONS, 2009 � 2016 ($BILLION)
TABLE 42 SPAIN: IVD MARKET REVENUE, BY APPLICATIONS, 2009 � 2016 ($BILLION)
TABLE 43 RUSSIA AGEING POPULATION
TABLE 44 RUSSIA: IVD MARKET REVENUE, BY APPLICATIONS, 2009 � 2016 ($BILLION)
TABLE 45 ASIA: IVD MARKET REVENUE, BY COUNTRY, 2009 � 2016 ($BILLION)
TABLE 46 ASIA: IVD MARKET REVENUE, BY APPLICATIONS, 2009 � 2016 ($BILLION)
TABLE 47 ASIA: CLINICAL CHEMISTRY MARKET REVENUE, BY COUNTRY, 2009 � 2016 ($BILLION)
TABLE 48 ASIA: IMMUNOASSAYS MARKET REVENUE, BY COUNTRY, 2009 � 2016 ($MILLION)
TABLE 49 ASIA: MOLECULAR DIAGNOSTICS MARKET REVENUE, BY COUNTRY, 2009 � 2016 ($MILLION)
TABLE 50 ASIA: HEMATOLOGY MARKET REVENUE, BY COUNTRY, 2009 � 2016 ($MILLION)
TABLE 51 ASIA: MICROBIOLOGY MARKET REVENUE, BY COUNTRY, 2009 � 2016 ($MILLION)
TABLE 52 ASIA: OTHERS MARKET REVENUE, BY COUNTRY, 2009 � 2016 ($MILLION)
TABLE 53 ASIA: IVD MARKET REVENUE, BY END-USERS, 2009 � 2016 ($BILLION)
TABLE 54 JAPAN: IVD MARKET REVENUE, BY APPLICATIONS, 2009 � 2016 ($MILLION)
TABLE 55 CHINA: IVD MARKET REVENUE, BY APPLICATIONS, 2009 � 2016 ($MILLION)
TABLE 56 INDIA: IVD MARKET REVENUE, BY APPLICATIONS, 2009 � 2016 ($MILLION)
TABLE 57 ABBOTT LABORATORIES: TOTAL REVENUE AND R&D EXPENSES, 2008 � 2010 ($MILLION)
TABLE 58 ABBOTT LABORATORIES: TOTAL REVENUE, BY SEGMENTS, 2008 � 2010 ($MILLION)
TABLE 59 ABBOTT LABORATORIES: TOTAL REVENUE, GEOGRAPHY, 2008 � 2010 ($MILLION)
TABLE 60 ALERE INC: TOTAL REVENUE AND R&D EXPENSES, 2008 � 2010 ($MILLION)
TABLE 61 ALERE INC: TOTAL REVENUE, BY SEGMENTS, 2008 � 2010 ($MILLION)
TABLE 62 ALERE INC: TOTAL REVENUE, BY GEOGRAPHY, 2008 � 2010 ($MILLION)
TABLE 63 BECKMAN COULTER INC: TOTAL REVENUE AND R&D EXPENSES, 2008 � 2010 ($MILLION)
TABLE 64 BECKMAN COULTER INC: TOTAL REVENUE, BY SEGMENTS, 2008 � 2010 ($MILLION)
TABLE 65 BECKMAN COULTER INC: TOTAL REVENUE, BY GEOGRAPHY, 2008 � 2010 ($MILLION)
TABLE 66 BECTON DICKINSON AND COMPANY: TOTAL REVENUE AND R&D EXPENSES, 2008 � 2010 ($MILLION)
TABLE 67 BECTON DICKINSON AND COMPANY: TOTAL REVENUE, BY SEGMENTS, 2008 � 2010 ($MILLION)
TABLE 68 BECTON DICKINSON AND COMPANY: TOTAL REVENUE, BY GEOGRAPHY, 2008 � 2010 ($MILLION)
TABLE 69 BIOMERIEUX S.A.: TOTAL REVENUE AND R&D EXPENSES, 2008 � 2010 ($MILLION)
TABLE 70 BIOMERIEUX S.A.: TOTAL REVENUE, BY SEGMENTS, 2008 � 2010 ($MILLION)
TABLE 71 BIOMERIEUX S.A.: TOTAL REVENUE, BY GEOGRAPHY, 2008 � 2010 ($MILLION)
TABLE 72 BIO-RAD LABORATORIES INC: TOTAL REVENUE AND R&D EXPENSES, 2008 � 2010 ($MILLION)
TABLE 73 BIO-RAD LABORATORIES INC: TOTAL REVENUE, BY SEGMENTS, 2008 � 2010 ($MILLION)
TABLE 74 BIO-RAD LABORATORIES INC: TOTAL REVENUE, BY GEOGRAPHY, 2008 � 2010 ($MILLION)
TABLE 75 DIASORIN DIAGNOSTIC S.P.A.: TOTAL REVENUE AND R&D EXPENSES, 2008 � 2010 ($MILLION)
TABLE 76 DIASORIN DIAGNOSTIC S.P.A.: TOTAL REVENUE, BY TECHNOLOGY, 2008 � 2010 ($MILLION)
TABLE 77 DIASORIN DIAGNOSTIC S.P.A: TOTAL REVENUE, BY GEOGRAPHY, 2008 � 2010 ($MILLION)
TABLE 78 GEN-PROBE INCORPORATED: TOTAL REVENUE AND R&D EXPENSES, 2008 � 2010 ($MILLION)
TABLE 79 GEN-PROBE INCORPORATED: TOTAL REVENUE, BY SEGMENTS, 2008 � 2010 ($MILLION)
TABLE 80 GEN-PROBE INCORPORATED: TOTAL REVENUE, BY GEOGRAPHY, 2008 � 2010 ($MILLION)
TABLE 81 HOLOGIC INC: TOTAL REVENUE AND R&D EXPENSES, 2008 � 2010 ($MILLION)
TABLE 82 HOLOGIC INC: TOTAL REVENUE, BY SEGMENTS, 2008 � 2010 ($MILLION)
TABLE 83 HORIBA LTD: TOTAL REVENUE AND R&D EXPENSES, 2008 � 2010 ($MILLION)
TABLE 84 HORIBA LTD: TOTAL REVENUE, BY SEGMENTS, 2008 � 2010 ($MILLION)
TABLE 85 LUMINEX CORPORATION: TOTAL REVENUE AND R&D EXPENSES, 2008 � 2010 ($MILLION)
TABLE 86 LUMINEX CORPORATION: TOTAL REVENUE, BY SEGMENTS, 2008 � 2010 ($MILLION)
TABLE 87 LUMINEX CORPORATION: TOTAL REVENUE, BY GEOGRAPHY, 2008 � 2010 ($MILLION)
TABLE 88 MINDRAY MEDICAL INTERNATIONAL LIMITED: TOTAL REVENUE AND R&D EXPENSES, 2008 - 2010 ($MILLION)
TABLE 89 MINDRAY MEDICAL INTERNATIONAL LIMITED: TOTAL REVENUE, BY SEGMENTS, 2008 � 2010 ($MILLION)
TABLE 90 MINDRAY MEDICAL INTERNATIONAL LIMITED: TOTAL REVENUE, BY GEOGRAPHY, 2008 � 2010 ($MILLION)
TABLE 91 NOVARTIS INTERNATIONAL AG: TOTAL REVENUE AND R&D EXPENSES, 2008 � 2011 ($MILLION)
TABLE 92 NOVARTIS INTERNATIONAL AG: TOTAL REVENUE, BY SEGMENTS, 2008 � 2011 ($MILLION)
TABLE 93 NOVARTIS INTERNATIONAL AG: TOTAL REVENUE, BY GEOGRAPHY, 2008 � 2010 ($MILLION)
TABLE 94 ORTHO CLINICAL DIAGNOSTICS: TOTAL REVENUE AND R&D EXPENSES, 2008 � 2010 ($MILLION)
TABLE 95 ORTHO CLINICAL DIAGNOSTICS: TOTAL REVENUE, BY MEDICAL DEVICES SEGMENTS, 2008 � 2010 ($MILLION)
TABLE 96 JOHNSON & JOHNSON: TOTAL REVENUE, BY DIAGNOSTICS SEGMENTS, 2008 � 2010 ($MILLION)
TABLE 97 JOHNSON & JOHNSON: TOTAL REVENUE, BY GEOGRAPHY, 2008 � 2010 ($MILLION)
TABLE 98 QIAGEN N.V: TOTAL REVENUE AND R&D EXPENSES, 2008 � 2010 ($MILLION)
TABLE 99 QIAGEN N.V.: TOTAL REVENUE, BY SEGMENTS, 2008 � 2010 ($MILLION)
TABLE 100 QIAGEN N.V.: TOTAL REVENUE, BY GEOGRAPHY, 2008 � 2010 ($MILLION)
TABLE 101 ROCHE: TOTAL REVENUE AND R&D EXPENSES, 2008 � 2010 ($MILLION)
TABLE 102 ROCHE: TOTAL REVENUE, BY SEGMENTS, 2008 � 2010 ($MILLION)
TABLE 103 SIEMENS: TOTAL REVENUE AND R&D EXPENSES, 2008 � 2010 ($MILLION)
TABLE 104 SIEMENS: TOTAL REVENUE, BY SEGMENTS, 2008 � 2010 ($MILLION)
TABLE 105 SIEMENS: TOTAL REVENUE, BY GEOGRAPHY, 2008 � 2010 ($MILLION)
TABLE 106 SYSMEX CORPORATION: TOTAL REVENUE AND R&D EXPENSES, 2009 � 2011 ($MILLION)
TABLE 107 SYSMEX CORPORATION: TOTAL REVENUE, BY SEGMENTS, 2009 � 2011 ($MILLION)
TABLE 108 SYSMEX CORPORATION: TOTAL REVENUE, BY GEOGRAPHY, 2009 � 2011 ($MILLION)
TABLE 109 THERMO FISHER SCIENTIFIC INC: TOTAL REVENUE AND R&D EXPENSES, 2008 � 2010 ($MILLION)
TABLE 110 THERMO FISHER SCIENTIFIC INC: TOTAL REVENUE, BY SEGMENTS, 2008 � 2010 ($MILLION)
TABLE 111 THERMO FISHER SCIENTIFIC INC: TOTAL REVENUE, BY GEOGRAPHY, 2008 � 2010 ($MILLION)
LIST OF FIGURES
FIGURE 1 MARKET SEGMENTATION
FIGURE 2 GLOBAL IVD MARKET SHARE, BY COMPANY, 2011
FIGURE 3 GLOBAL IVD MARKET SHARE, BY END-USERS, 2011
FIGURE 4 GLOBAL IVD MARKET SHARE, BY TYPES, 2011
FIGURE 5 CHANGES IN LONG TERM CARE EXPENDITURE OF JAPAN, 2006 � 2055 ($BILLION)
FIGURE 6 KEY GROWTH STRATEGIES, 2009 � 2011

 Generating Response ...


Growth opportunities and latent adjacency in In-Vitro Diagnostic (IVD) Market