Titanium Dioxide Market

Report Code CH 5111
Published in Oct, 2024, By MarketsandMarkets™
Download PDF

Choose License Type

Buy Report Now Inquire Before Buying

Titanium Dioxide Market by Grade (Rutile, Anatase), Process (Sulfate, Chloride), Application (Paints & Coating, Plastics, Paper, Inks), & Region (North America, Europe, Asia Pacific, MEA, South America) - Global Forecasts Up to 2029

Updated on : February 07, 2025

Titanium Dioxide Market

The titanium dioxide market is estimated to increase from USD 20.72 billion in 2024 to USD 24.41 billion by the end of 2029, expanding at a CAGR of 3.3%. This rise has mainly been triggered due to increased demand from various sectors, such as paints and coatings, plastics, paper, and cosmetics. Widely recognized for its outstanding whitening, brightening, and UV resistance properties, titanium dioxide is becoming imperative for these industries.

Expansion of the construction and automotive industries is majorly attributed to this trend. In other words, its demand is experiencing an upward graph, especially within emerging markets. Increasing demand for personal care products also fuels consumption of titanium dioxide. The primary producers are slowly shifting towards chloride process for production of titanium dioxide. This move will improve growth prospects in markets like North America and Europe. It is the preference because it produces higher-purity titanium dioxide with less impurity as compared to the traditional sulfate process.

Attractive Opportunities in the Titanium Dioxide Market

Asia Pacific

The titanium dioxide market in Asia Pacific is expected to grow due to increasing demand from industries such as paints and coatings, plastics, and cosmetics, driven by rapid urbanization, infrastructure development, and rising disposable incomes in the region.

The global titanium dioxide market will grow due to rising demand in construction, automotive and packaging sectors

Acquisitions, expansion and product launches are expected to offer lucrative opportunities for market players during the next five years.

The titanium dioxide in Asia Pacific is expected to be worth USD 9.64 billion by 2029.

Stringent environmental policies of governments regarding production of titanium dioxide is a major factor restraining the growth of the titanium dioxide market

Global Titanium Dioxide Market Dynamics

Driver: Thriving construction sector worldwide

The global construction industry is one of the major drivers of the growth of the titanium dioxide market. The product is highly valued for its high refractive index and exceptional light-scattering properties, which make it a vital additive in paints, coatings, and pigments. The flourishing construction sector, which includes residential, non-residential, and infrastructure projects, is one of the key drivers for paints and coatings demand worldwide. According to the World Bank, growth in the world construction industry at an annual growth rate of 4.2% between 2018 and 2023 in terms of market value suggests significant expansion possibilities across various segments of construction.

The construction activities in developed economies have followed a positive trend. The US housing market has also seen a continuous growth. As an increasing number of infra and construction projects are announced, the increased demand for paints and coatings will also increase the requirement for titanium dioxide. Growth trends are also being seen in developing economies. China and India lead construction activities in the Asia Pacific region, which happens to be the largest market for titanium dioxide. The sector growth within this region is influenced by a fast pace of urbanization, industrialization, the increase in PPP, superior living standards, and higher disposable incomes. China and India, being the significant markets for titanium dioxide in construction applications, consolidate and makes the Asia Pacific region the largest market for the industry.

Restraints: Strict environmental policies/regulations of government regarding titanium dioxide

There are two primary processes in the production of titanium dioxide: the sulfate process, where sulfuric acid is used, and the chloride process, which uses chlorine. Both of these produce a large quantity of waste; hence, very strict governmental regulations around the world have been implemented to check the emission of these wastes and ensure their proper disposal. Among these, the sulfate process generates more waste. China is the biggest global producer of titanium dioxide, relying mostly on the sulfate process. Such a result means huge discharge of acid into seawater. The acidic nature/tendency of titanium dioxide waste causes significant ecological problems when not managed responsibly. The improper methods applied in disposing of titanium dioxide waste result in severe environmental hazards. The addition of acid in the sea water reduces the pH values significantly, lowers oxygen levels, and endangers marine ecosystems. When dumped on land, sulfuric acid released is released to the air.

To counter these effects, the governments, especially in Europe and China, have implemented severe environmental policies to control the discharged waste produced through the process of manufacturing titanium dioxide. Such a policy does not allow the outlet of waste into seawater or river, with any discharge program, and ensures that wastewater management is highly coordinated. Even though these regulations serve the purpose of saving the environment, they simultaneously act as a restraint on the production of titanium dioxide, limiting the growth of this market in various regions.


Opportunity: Use of titanium dioxide in Lithium-ion batteries

Incorporation of titanium dioxide (TiO2) into lithium-ion batteries, using specifically lithium titanate (LTO) is one of the important opportunities for the titanium dioxide industry as well as for the electric vehicle market. The batteries, based on lithium titanate, are increasingly recognized as an attractive form of energy storage for EVs with significant benefits compared to the more conventional lithium-ion batteries, mainly in terms of cycle life, safety, and charging speed. Titanium dioxide is another important ingredient in the production of lithium titanate; it enables faster charge and discharge cycles, so these batteries are highly desirable for EV applications. LTO uses an alternative to the graphite anodes typically used in conventional lithium-ion cells, hence its extended lifespan-one battery can last more than 10,000 charge-discharge cycles, as compared to the standard lithium-ion battery's only 500–1,000 charge-discharge cycles. This durability greatly minimizes the requirement for frequent battery replacement, making it a cost-effective and sustainable option for EV manufacturers. The lithium titanate batteries also have better thermal stability. They are thus less susceptible to overheating which increases the safety of EVs. The performance/efficiency in low-temperature environments extend their appeal, especially for global EV adoption in different climates. Ultra-fast charging is another essential advantage, in which lithium titanate batteries can charge to 80% in minutes. This helps in minimizing idle time of consumers at the charging stations. However, lithium titanate has some disadvantages such as lower energy density, meaning less driving range of EVs in comparison with a regular lithium-ion battery. Other costs, such as titanium dioxide that is expensive, and the intricacy of production for lithium titanate batteries make production more costly and may impede its usage in mass-market EVs. However, a growing demand in the market, influenced by increasing global interest in electric vehicles through concerns about the environment and regulatory push, creates an opportunity for the development of lithium titanate batteries. The growing demand for faster, safer, and more reliable batteries places titanium dioxide at the forefront of enabling the next phase of EV technology. Faster, safer, and stronger batteries are creating new demand, so titanium dioxide acts as a main driver in the new wave of the future of electric vehicle technology. In addition to this, fast-charging application in electric buses and delivery cars, which supports lithium titanate-based batteries, escalates the potential even more.

Challenges: Safety concerns associated with titanium dioxide

Titanium dioxide has raised health concerns that result from TiO2 material's potential carcinogenic activity in food products and consumer-related applications. Notably, the European Union has rated titanium dioxide to be carcinogenic to humans. This is caused primarily through human inhalation to the development of diseases such as lung cancer. The International Agency for Research on Cancer has included titanium dioxide within its list possibly carcinogenic in nature to man due to potential human inhalation. This classification has led to several restrictions on its application in consumer products. For instance, the Code of Federal Regulations (CFR) has restricted the application of titanium dioxide in food by allowing it to constitute no more than 1% of the weight of a food. Moreover, unless the identity standards of a food allow for it, titanium dioxide should not be applied to food products. The presence of titanium dioxide or any mixture containing it should be indicated clearly on the label to avoid dangerous consumption. Titanium dioxide is produced through high-temperature and high-pressure processing, which yields a wide range of particle sizes with significant agglomeration that can affect human health.

Global Titanium Dioxide Market Ecosystem Analysis

The ecosystem of titanium dioxide involves raw material suppliers, titanium dioxide manufacturers, distributors, and end-users. Raw materials (ilmenite, rutile, and titanium slag) sourced from mining companies. Titanium Dioxide manufacturers, such as Chemours, Venator, Tronox, and Kronos, process raw titanium minerals into titanium dioxide pigment through either the chloride or sulfate process.


Rutile grade of titanium dioxide to register the highest CAGR during the forecast period

Rutile grade of titanium dioxide is currently the fastest-growing segment in the titanium dioxide market, by grade. This rapid growth in rutile-grade titanium dioxide is due to the superior properties such as higher refractive index, better ultraviolet resistance, and more durability. All these features make rutile-grade titanium dioxide very appealing for use in a wide variety of major applications, such as paints, coatings, plastics, and cosmetics. The rutile grade finds growing demands in high performance coatings, particularly in industries including automotive and industrial applications besides being used widely for constructional uses

Chloride process to register highest CAGR in the titanium dioxide market, by process.

The fastest-growing segment in the titanium dioxide market, by the production method/ process, is the chloride process. The growth in the chloride process can be attributed to the ability to produce higher qualities of titanium dioxide in greater volumes. The method uses raw materials like rutile and ilmenite, which are basically titanium-bearing ores. These are exposed to hot chlorine gas. Titanium tetrachloride forms as a result. Oxidation then takes place following purification to make the material purely titanium dioxide. The key strength of the process is its capability to provide excellent brightness, opacity, and well-balanced particle size distribution so that the final product is acceptable for use in a broad variety of end-use industries. Some of them include paints, coatings, plastics, and paper. Further growth in the usage of high-purity titanium dioxide in several of these end-user industries has created an upsurge in the process. Manufacturers are taking up the chloride method to adhere to increasingly demanding product quality norms, which have contributed to a rapid growth trend in regions like North America and Europe.

Paints & Coatings to lead the market by application in the Titanium Dioxide market.

The largest application segment of the titanium dioxide market is the paints and coatings sector. This industry is likely to remain the largest segment in the forecast period. Titanium dioxide is used for enhancing the performance of paints and coatings by improving coverage, brightness, whiteness, opacity, and durability. It is utilized in all types of paint and coating products, such as architectural coatings, automotive OEM coatings, general industrial finishes, powder coatings, aqueous paints, protective coatings, wood finishes, and many more. The growth of the paints and coatings market is led by the fast-expanding housing and construction sectors, increased gross domestic product (GDP), constant urbanization, and increase in disposable incomes. Advancement in technology of the automobile, wood, and industrial sector also supports the further growth of the market.

Asia Pacific is estimated to be the largest market in the titanium dioxide market.

Asia Pacific is the largest regional market for titanium dioxide (TiO2) at a global level. The significant growth in this region's construction industry and demand for paints and coatings drive its development. Titanium dioxide is one of the essential components used in paints and coatings for their opacity, brightness, and durability enhancing ability. The continued influx of infrastructure building and housing plans within the Asia Pacific region accelerates this requirement and cements its position at the top rank as the global leader in market size for TiO2.

One of the strongest growth drivers that propels construction works within the regions is government investment on infrastructures. The countries of China and India allocated substantial budgets toward infrastructural development for construction works. For example, China's 14th Five-Year Plan is expected to invest USD 4.2 trillion in transportation and urbanization projects. Similarly, the India's National Investment Pipeline has set aside USD 1.4 trillion for infrastructure, that too with a specific focus on renewable energy and urban infrastructure. These large-scale initiatives require huge volumes of paints and coatings, thereby further strengthening the demand for TiO2. Affordable housing projects are also a driving factor behind the growth of the construction industry, thus fuelling the TiO2 market. In Vietnam, government-aided social housing is propelled as a major industry driver. There has been a push from the Indian government to increase production to meet the housing needs of its population with various government-initiated schemes. Affordable housing projects require titanium dioxide-based paints and coatings for durability and cosmetics, augmenting the demand for TiO2 in the region. The Asia Pacific region is the leading global market for TiO2, and with continuous government investments, growing housing initiatives, and sustainability and technological advancement, it has become a critical support for the construction sector.

HIGHEST CAGR MARKET IN 2024-2029
MIDDLE EAST & AFRICA FASTEST GROWING MARKET IN THE REGION

Recent Developments of Titanium Dioxide Market

  • In November 2023, Cinkarna introduced a new series of TMP-free titanium dioxide pigments. The company released RC 813, RC 823, and RC 833, among others, as part of its line of TMP-free products.
  • In May 2020, Tronox Holdings plc signed an agreement with Eramet S.A (France) to acquire the TiZir Titanium and Iron business.
  • In May 2023, Chemours’s announcement of its latest high-performance grade titanium dioxide Ti-Pure TS-6700 was done. The product is suitable for waterborne architectural coatings. TMP and TME-free and thereby environment-friendly, this novel product features 100% renewable electricity use in the manufacturing process with organic bio-based surface treatment.
  • In January 2023, Chemours introduced its newest product in the Ti-Pure Sustainability (TS) series-Ti-Pure TS-1510. An extremely efficient rutile titanium dioxide pigment, it was engineered to provide improved processing performance in plastics, especially for polyolefin masterbatch applications.

Key Market Players

Want to explore hidden markets that can drive new revenue in Titanium Dioxide Market?

Scope of the Report

Report Metric Details
Market size available for years 2018-2029
Base Year Considered 2023
Forecast period 2024-2029
Forecast units Value (USD Million) Volume (Kilotons)
Segments covered Grade, Process, Application, and Region
Geographies covered North America, Asia Pacific, Europe, South America, and Middle East & Africa.


Key Questions Addressed by the Report

What primary factor is fuelling the growth of the titanium dioxide market?
The key factor driving the growth of the titanium dioxide market is increasing demand from the paints, coatings, and plastics industries. The ‘paint and coatings’ industry is one of the chemical industries that manufactures, sells, and distributes paints, stains, and other coatings. TiO2’s key role is acting as a white pigment material, which scatters visible light to give a bright colour to the paint. Titanium dioxide also protects plastics from damages of UV rays that affect the plastic appearance and cause it to get old. The paint and coating sector is a major reason or the growth of the titanium dioxide market.
How is the titanium dioxide market segmented in terms of grade?
The titanium dioxide market based on grade is segmented as Rutile and Anatase.
What are the major challenges in the titanium dioxide market?
The safety concerns and safety prospects associated with titanium dioxide is the major market challenge in the titanium dioxide market.
What are the major opportunities in the titanium dioxide market?
Application of titanium dioxide in preparation of green hydrogen and use of nano particles of TiO2 in cosmetics & construction sectors are key opportunities in the titanium dioxide market.
Which region has the most significant demand?
The Asia Pacific (APAC) region stands out as having the highest demand (consumption wise) for titanium dioxide.
Who are the major manufacturers of titanium dioxide?
Major players in the titanium dioxide market are Evonik Industries AG (Germany), Tayca Corporation (Japan), The Chemours Company (US), Tronox Holdings Plc (US), LB Group (China), Kronos Worldwide, Inc. (US), Venator Materials PLC (UK), INEOS Group Limited (UK), CNNC Huayuan Titanium Dioxide Co., Ltd. (China), and Cinkarna Celje d.d. (Slovenia).


Personalize This Research

  • Triangulate with your Own Data
  • Get Data as per your Format and Definition
  • Gain a Deeper Dive on a Specific Application, Geography, Customer or Competitor
  • Any level of Personalization
Request A Free Customisation

Let Us Help You

  • What are the Known and Unknown Adjacencies Impacting the Titanium Dioxide Market
  • What will your New Revenue Sources be?
  • Who will be your Top Customer; what will make them switch?
  • Defend your Market Share or Win Competitors
  • Get a Scorecard for Target Partners
Customized Workshop Request

Table Of Contents

Exclusive indicates content/data unique to MarketsandMarkets and not available with any competitors.

TITLE
PAGE NO
INTRODUCTION
23
RESEARCH METHODOLOGY
28
EXECUTIVE SUMMARY
37
PREMIUM INSIGHTS
41
MARKET OVERVIEW
45
  • 5.1 INTRODUCTION
    DRIVERS
    - Thriving construction sector worldwide
    - Growing demand for do-it-yourself paint & coating solutions
    - Surging demand for lightweight vehicles
    - Booming cosmetics and personal care industries
    - Increasing use of titanium dioxide in plastics and packaging industries
    RESTRAINTS
    - Stringent environmental policies of governments regarding production of titanium dioxide
    OPPORTUNITIES
    - Efficient use of titanium dioxide in lithium-ion battery components
    - Hydrogen generation using titanium dioxide (TiO2)
    - High adoption of ultrafine particles of titanium dioxide in cosmetics and construction industries
    - Increased use of titanium dioxide as photocatalyst
    - Potential use in advancing sustainable packaging and printing solutions
    CHALLENGES
    - Concerns about safety of titanium dioxide
    - Volatility in cost of titanium dioxide
INDUSTRY TRENDS
55
  • 6.1 TRENDS/DISRUPTIONS IMPACTING CUSTOMER BUSINESSES
  • 6.2 PRICING ANALYSIS
    INDICATIVE PRICE TREND OF KEY PLAYERS, BY APPLICATION
    AVERAGE SELLING PRICE TREND OF TITANIUM DIOXIDE, BY REGION, 2022–2029
    AVERAGE SELLING PRICE TREND OF TITANIUM DIOXIDE, BY REGION
  • 6.3 VALUE CHAIN ANALYSIS
    RAW MATERIAL SUPPLIERS
    MANUFACTURERS
    DISTRIBUTORS
    END-USE SECTORS
  • 6.4 ECOSYSTEM ANALYSIS
  • 6.5 IMPACT OF GEN AI ON PAINTS & COATINGS MARKET
  • 6.6 TECHNOLOGY ANALYSIS
    KEY TECHNOLOGIES
    - Method of manufacturing titanium dioxide using chlorite process
    - Method of manufacturing titanium dioxide using sulfate process
    - Surface treatment of titanium dioxide
    COMPLEMENTARY TECHNOLOGIES
    - Dye-sensitized solar cells (DSSC)
    - Nanotechnology
    ADJACENT TECHNOLOGIES
    - Use of titanium dioxide (TiO2) in green hydrogen production
  • 6.7 IMPACT OF AI ON TITANIUM DIOXIDE MARKET
  • 6.8 PATENT ANALYSIS
    INTRODUCTION
    METHODOLOGY
    PATENT ANALYSIS (2015–2024)
  • 6.9 TRADE ANALYSIS
    EXPORT DATA (HS CODE 282300)
    IMPORT DATA (HS CODE 282300)
    EXPORT DATA (HS CODE 320611)
    EXPORT DATA (HS CODE 320611)
  • 6.10 KEY CONFERENCES AND EVENTS, 2025
  • 6.11 REGULATORY LANDSCAPE
    REGULATORY BODIES, GOVERNMENT AGENCIES, AND OTHER ORGANIZATIONS
    REGULATIONS RELATED TO TITANIUM DIOXIDE INDUSTRY
    - REACH – ECHA Regulation
    CODE OF FEDERAL REGULATION (CFR)
    REGULATION ON USE OF TITANIUM DIOXIDE IN SUNSCREENS
    REGULATION ON USE OF TITANIUM DIOXIDE IN FOOD
    REGULATION ON USE OF TITANIUM DIOXIDE IN PHARMACEUTICALS
  • 6.12 PORTER’S FIVE FORCES ANALYSIS
    BARGAINING POWER OF SUPPLIERS
    BARGAINING POWER OF BUYERS
    INTENSITY OF COMPETITIVE RIVALRY
    THREAT OF NEW ENTRANTS
    THREAT OF SUBSTITUTES
  • 6.13 KEY STAKEHOLDERS & BUYING CRITERIA
    KEY STAKEHOLDERS IN BUYING PROCESS
    BUYING CRITERIA
  • 6.14 CASE STUDY ANALYSIS
    UTILIZATION OF INNOVATIVE NANO TITANIUM PIGMENTS IN COSMETICS INDUSTRY
    USE OF TITANIUM DIOXIDE AS PHOTOCATALYST TO PREVENT AIR POLLUTION
    TITANIUM DIOXIDE – PH
  • 6.15 MACROECONOMIC ANALYSIS
    INTRODUCTION
    GDP TRENDS AND FORECASTS
    CONTRIBUTION OF CONSTRUCTION INDUSTRY TO GDP
    GLOBAL AUTOMOBILE PRODUCTION AND GROWTH
    ILMENITE MINE PRODUCTION AND RESERVES
    RUTILE MINE PRODUCTION AND RESERVES
  • 6.16 CONSTRUCTION INDUSTRY INVESTMENT & FUNDING SCENARIO
TITANIUM DIOXIDE MARKET, BY GRADE
94
  • 7.1 INTRODUCTION
  • 7.2 RUTILE
    GROWING APPLICATION IN PAINTS & COATINGS FOR SCATTERING LIGHT IN PAINT FILMS
  • 7.3 ANATASE
    INCREASING UTILIZATION OF ANATASE-GRADE TITANIUM DIOXIDE IN PHOTOCATALYTIC APPLICATIONS
TITANIUM DIOXIDE MARKET, BY PROCESS
98
  • 8.1 INTRODUCTION
  • 8.2 CHLORIDE
    REQUIREMENT OF HIGH-QUALITY TITANIUM DIOXIDE
  • 8.3 SULFATE
    COST-EFFECTIVE PROCESSING OF LOWER-GRADE ORES
TITANIUM DIOXIDE MARKET, BY APPLICATION
103
  • 9.1 INTRODUCTION
  • 9.2 PAINTS & COATINGS
    INCREASING USE OF TITANIUM DIOXIDE IN PAINTS & COATINGS
  • 9.3 PLASTICS
    ENHANCED PERFORMANCE OF PLASTICS
  • 9.4 PAPER
    INCREASED DEMAND FOR DECORATIVE PAPERS
  • 9.5 INK
    CONSIDERABLE INCREASE IN DEMAND FROM ASIA PACIFIC
  • 9.6 OTHER APPLICATIONS
TITANIUM DIOXIDE MARKET, BY REGION
110
  • 10.1 INTRODUCTION
  • 10.2 ASIA PACIFIC
    CHINA
    - Increase in demand from paints & coatings industry
    INDIA
    - Make in India initiative to drive demand for titanium dioxide-infused coatings for industrial applications
    JAPAN
    - Increased demand for titanium dioxide pigments for automotive coatings
    SOUTH KOREA
    - Increasing applications in paints & coatings
    AUSTRALIA
    - High feedstock availability for manufacturing titanium dioxide
    REST OF ASIA PACIFIC
  • 10.3 NORTH AMERICA
    US
    - Growing use in construction and cosmetics sectors
    CANADA
    - Growth of construction sector driving demand
    MEXICO
    - Rising demand for paints & coatings in residential segment
  • 10.4 EUROPE
    GERMANY
    - Declining construction industry
    UK
    - Significant increase in use of decorative paints & coatings
    FRANCE
    - Increasing usage in paints & coatings
    RUSSIA
    - Steady development of construction sector
    ITALY
    - Rising investments in construction industry
    REST OF EUROPE
  • 10.5 MIDDLE EAST & AFRICA
    GCC COUNTRIES
    - Saudi Arabia
    - UAE
    - Rest of GCC countries
    SOUTH AFRICA
    - Demand for high titanium content feedstocks
    REST OF MIDDLE EAST & AFRICA
  • 10.6 SOUTH AMERICA
    BRAZIL
    - Growing paints & coatings sector
    ARGENTINA
    - Investments in small-scale infrastructure projects
    REST OF SOUTH AMERICA
COMPETITIVE LANDSCAPE
184
  • 11.1 OVERVIEW
  • 11.2 KEY PLAYER STRATEGIES/RIGHT TO WIN
  • 11.3 MARKET SHARE ANALYSIS (2023)
  • 11.4 REVENUE ANALYSIS
  • 11.5 COMPANY VALUATION & FINANCIAL METRICS
  • 11.6 BRAND/PRODUCT COMPARISON
  • 11.7 COMPANY EVALUATION MATRIX: KEY PLAYERS, 2023
    STARS
    EMERGING LEADERS
    PERVASIVE PLAYERS
    PARTICIPANTS
    COMPANY FOOTPRINT: KEY PLAYERS, 2023
    - Company footprint
    - Type footprint
    - Type footprint
    - Application footprint
    - Region footprint
  • 11.8 COMPANY EVALUATION MATRIX: STARTUPS/SMES, 2023
    PROGRESSIVE COMPANIES
    RESPONSIVE COMPANIES
    DYNAMIC COMPANIES
    STARTING BLOCKS
    TITANIUM DIOXIDE MARKET: COMPETITIVE BENCHMARKING OF KEY STARTUPS/SMES, 2023
    - Detailed list of startups/SMEs
    - Competitive benchmarking of key startups/SMEs
  • 11.9 COMPETITIVE SCENARIO
    PRODUCT LAUNCHES
    DEALS
    EXPANSIONS
    OTHER DEVELOPMENTS
COMPANY PROFILES
209
  • 12.1 KEY PLAYERS
    THE CHEMOURS COMPANY
    - Business overview
    - Products offered
    - Recent developments
    - MnM view
    TRONOX HOLDINGS PLC
    - Business overview
    - Products offered
    - Recent developments
    - MnM view
    LB GROUP
    - Business overview
    - Products offered
    - Recent developments
    - MnM view
    KRONOS WORLDWIDE, INC.
    - Business overview
    - Products offered
    - Recent developments
    - MnM view
    VENATOR MATERIALS PLC
    - Business overview
    - Products offered
    - Recent developments
    - MnM view
    INEOS GROUP LIMITED
    - Business overview
    - Products offered
    - Recent developments
    - MnM view
    CNNC HUAYUAN TITANIUM DIOXIDE CO., LTD.
    - Business overview
    - Products offered
    - Recent developments
    - MnM view
    CINKARNA CELJE D.D.
    - Business overview
    - Products offered
    - Recent developments
    - MnM view
    EVONIK INDUSTRIES AG
    - Business overview
    - Products offered
    - MnM view
    TAYCA CORPORATION
    - Business overview
    - Products offered
    - MnM view
  • 12.2 OTHER PLAYERS
    TITANOS GROUP
    GPRO TITANIUM INDUSTRY CO., LTD.
    GUANGDONG HUIYUN TITANIUM CO., LTD.
    SHANDONG JINHAI TITANIUM RESOURCES TECHNOLOGY CO., LTD.
    KUMYANG CO., LTD
    TRAVANCORE TITANIUM PRODUCTS LTD.
    PRECHEZA A.S.
    THE KISH COMPANY, INC.
    MEGHMANI ORGANICS LTD.
    THE KERALA MINERALS & METALS LIMITED
    TOR MINERALS
    KUNCAI
    DAWN GROUP
    QIANJIANG FANGYUAN TITANIUM INDUSTRY CO., LTD.
    GUANGXI JINMAO TITANIUM INDUSTRY
APPENDIX
273
  • 13.1 DISCUSSION GUIDE
  • 13.2 KNOWLEDGESTORE: MARKETSANDMARKETS SUBSCRIPTION PORTAL
  • 13.3 AVAILABLE CUSTOMIZATIONS
  • 13.4 RELATED REPORTS
  • 13.5 AUTHOR DETAILS
LIST OF TABLES
 
  • TABLE 1 MARKET SEGMENT DEFINITION, BY GRADE
  • TABLE 2 MARKET SEGMENT DEFINITION, BY PROCESS
  • TABLE 3 MARKET SEGMENT DEFINITION, BY APPLICATION
  • TABLE 4 WORLD POPULATION AND URBANIZATION, BY REGION, 2021 VS. 2050 (MILLION)
  • TABLE 5 POPULATION GROWTH, BY REGION, 2022 VS. 2030 VS. 2050 (MILLION)
  • TABLE 6 INDICATIVE PRICING TREND OF KEY PLAYERS, BY APPLICATION, 2023 (USD/KG)
  • TABLE 7 AVERAGE SELLING PRICE TREND, BY REGION, 2022–2029 (USD/KG)
  • TABLE 8 ECOSYSTEM OF TITANIUM DIOXIDE MARKET
  • TABLE 9 TITANIUM DIOXIDE MARKET: LIST OF MAJOR PATENTS, 2022–2024
  • TABLE 10 TITANIUM DIOXIDE MARKET: LIST OF KEY CONFERENCES AND EVENTS, 2025
  • TABLE 11 NORTH AMERICA: REGULATORY BODIES, GOVERNMENT AGENCIES, AND OTHER ORGANIZATIONS
  • TABLE 12 EUROPE: REGULATORY BODIES, GOVERNMENT AGENCIES, AND OTHER ORGANIZATIONS
  • TABLE 13 ASIA PACIFIC: REGULATORY BODIES, GOVERNMENT AGENCIES, AND OTHER ORGANIZATIONS
  • TABLE 14 TITANIUM DIOXIDE MARKET: PORTER’S FIVE FORCES ANALYSIS
  • TABLE 15 INFLUENCE OF STAKEHOLDERS ON BUYING PROCESS
  • TABLE 16 KEY BUYING CRITERIA FOR TITANIUM DIOXIDE INDUSTRY
  • TABLE 17 WORLD GDP GROWTH PROJECTION, 2021–2028 (USD TRILLION)
  • TABLE 18 CONTRIBUTION OF CONSTRUCTION INDUSTRY TO GDP, BY KEY COUNTRY, 2021
  • TABLE 19 GLOBAL AUTOMOBILE PRODUCTION (UNIT) AND GROWTH, BY COUNTRY, 2021 VS. 2022
  • TABLE 20 ILMENITE MINE PRODUCTION AND RESERVES, BY KEY COUNTRY, 2022 AND 2023
  • TABLE 21 RUTILE MINE PRODUCTION AND RESERVES, BY KEY COUNTRY, 2022 AND 2023
  • TABLE 22 DIFFERENCE BETWEEN RUTILE AND ANATASE
  • TABLE 23 TITANIUM DIOXIDE MARKET, BY GRADE, 2018–2021 (USD MILLION)
  • TABLE 24 TITANIUM DIOXIDE MARKET, BY GRADE, 2022–2029 (USD MILLION)
  • TABLE 25 TITANIUM DIOXIDE MARKET, BY GRADE, 2018–2021 (KILOTON)
  • TABLE 26 TITANIUM DIOXIDE MARKET, BY GRADE, 2022–2029 (KILOTON)
  • TABLE 27 TITANIUM DIOXIDE PRODUCTION CAPACITY OF MAJOR PLAYERS, BY PROCESS TYPE, 2023
  • TABLE 28 TITANIUM DIOXIDE PRODUCTION PROCESS COMPARISON
  • TABLE 29 TITANIUM DIOXIDE MARKET, BY PROCESS, 2018–2021 (USD MILLION)
  • TABLE 30 TITANIUM DIOXIDE MARKET, BY PROCESS, 2022–2029 (USD MILLION)
  • TABLE 31 TITANIUM DIOXIDE MARKET, BY PROCESS, 2018–2021 (KILOTON)
  • TABLE 32 TITANIUM DIOXIDE MARKET, BY PROCESS, 2022–2029 (KILOTON)
  • TABLE 33 TITANIUM DIOXIDE MARKET, BY APPLICATION, 2018–2021 (USD MILLION)
  • TABLE 34 TITANIUM DIOXIDE MARKET, BY APPLICATION, 2022–2029 (USD MILLION)
  • TABLE 35 TITANIUM DIOXIDE MARKET, BY APPLICATION, 2018–2021 (KILOTON)
  • TABLE 36 TITANIUM DIOXIDE MARKET, BY APPLICATION, 2022–2029 (KILOTON)
  • TABLE 37 TITANIUM DIOXIDE MARKET, BY REGION, 2018–2021 (USD MILLION)
  • TABLE 38 TITANIUM DIOXIDE MARKET, BY REGION, 2022–2029 (USD MILLION)
  • TABLE 39 TITANIUM DIOXIDE MARKET, BY REGION, 2018–2021 (KILOTON)
  • TABLE 40 TITANIUM DIOXIDE MARKET, BY REGION, 2022–2029 (KILOTON)
  • TABLE 41 ASIA PACIFIC: TITANIUM DIOXIDE MARKET, BY COUNTRY, 2022–2029 (USD MILLION)
  • TABLE 42 ASIA PACIFIC: TITANIUM DIOXIDE MARKET, BY COUNTRY, 2022–2029 (KILOTON)
  • TABLE 43 ASIA PACIFIC: TITANIUM DIOXIDE MARKET, BY GRADE, 2018–2021 (USD MILLION)
  • TABLE 44 ASIA PACIFIC: TITANIUM DIOXIDE MARKET, BY GRADE, 2022–2029 (USD MILLION)
  • TABLE 45 ASIA PACIFIC: TITANIUM DIOXIDE MARKET, BY GRADE, 2018–2021 (KILOTON)
  • TABLE 46 ASIA PACIFIC: TITANIUM DIOXIDE MARKET, BY GRADE, 2022–2029 (KILOTON)
  • TABLE 47 ASIA PACIFIC: TITANIUM DIOXIDE MARKET, BY PROCESS, 2018–2021 (USD MILLION)
  • TABLE 48 ASIA PACIFIC: TITANIUM DIOXIDE MARKET, BY PROCESS, 2022–2029 (USD MILLION)
  • TABLE 49 ASIA PACIFIC: TITANIUM DIOXIDE MARKET, BY PROCESS, 2018–2021 (KILOTON)
  • TABLE 50 ASIA PACIFIC: TITANIUM DIOXIDE MARKET, BY PROCESS, 2022–2029 (KILOTON)
  • TABLE 51 ASIA PACIFIC: TITANIUM DIOXIDE MARKET, BY APPLICATION, 2018–2021 (USD MILLION)
  • TABLE 52 ASIA PACIFIC: TITANIUM DIOXIDE MARKET, BY APPLICATION, 2022–2029 (USD MILLION)
  • TABLE 53 ASIA PACIFIC: TITANIUM DIOXIDE MARKET, BY APPLICATION, 2018–2021 (KILOTON)
  • TABLE 54 ASIA PACIFIC: TITANIUM DIOXIDE MARKET, BY APPLICATION, 2022–2029 (KILOTON)
  • TABLE 55 CHINA: TITANIUM DIOXIDE MARKET, BY GRADE, 2022–2029 (USD MILLION)
  • TABLE 56 CHINA: TITANIUM DIOXIDE MARKET, BY GRADE, 2022–2029 (KILOTON)
  • TABLE 57 CHINA: TITANIUM DIOXIDE MARKET, BY APPLICATION, 2022–2029 (USD MILLION)
  • TABLE 58 CHINA: TITANIUM DIOXIDE MARKET, BY APPLICATION, 2022–2029 (KILOTON)
  • TABLE 59 INDIA: TITANIUM DIOXIDE MARKET, BY GRADE, 2022–2029 (USD MILLION)
  • TABLE 60 INDIA: TITANIUM DIOXIDE MARKET, BY GRADE, 2022–2029 (KILOTON)
  • TABLE 61 INDIA: TITANIUM DIOXIDE MARKET, BY APPLICATION, 2022–2029 (USD MILLION)
  • TABLE 62 INDIA: TITANIUM DIOXIDE MARKET, BY APPLICATION, 2022–2029 (KILOTON)
  • TABLE 63 JAPAN: TITANIUM DIOXIDE MARKET, BY GRADE, 2022–2029 (USD MILLION)
  • TABLE 64 JAPAN: TITANIUM DIOXIDE MARKET, BY GRADE, 2022–2029 (KILOTON)
  • TABLE 65 JAPAN: TITANIUM DIOXIDE MARKET, BY APPLICATION, 2022–2029 (USD MILLION)
  • TABLE 66 JAPAN: TITANIUM DIOXIDE MARKET, BY APPLICATION, 2022–2029 (KILOTON)
  • TABLE 67 SOUTH KOREA: TITANIUM DIOXIDE MARKET, BY GRADE, 2022–2029 (USD MILLION)
  • TABLE 68 SOUTH KOREA: TITANIUM DIOXIDE MARKET, BY GRADE, 2022–2029 (KILOTON)
  • TABLE 69 SOUTH KOREA: TITANIUM DIOXIDE MARKET, BY APPLICATION, 2022–2029 (USD MILLION)
  • TABLE 70 SOUTH KOREA: TITANIUM DIOXIDE MARKET, BY APPLICATION, 2022–2029 (KILOTON)
  • TABLE 71 AUSTRALIA: TITANIUM DIOXIDE MARKET, BY GRADE, 2022–2029 (USD MILLION)
  • TABLE 72 AUSTRALIA: TITANIUM DIOXIDE MARKET, BY GRADE, 2022–2029 (KILOTON)
  • TABLE 73 AUSTRALIA: TITANIUM DIOXIDE MARKET, BY APPLICATION, 2022–2029 (USD MILLION)
  • TABLE 74 AUSTRALIA: TITANIUM DIOXIDE MARKET, BY APPLICATION, 2022–2029 (KILOTON)
  • TABLE 75 REST OF ASIA PACIFIC: TITANIUM DIOXIDE MARKET, BY GRADE, 2022–2029 (USD MILLION)
  • TABLE 76 REST OF ASIA PACIFIC: TITANIUM DIOXIDE MARKET, BY GRADE, 2022–2029 (KILOTON)
  • TABLE 77 REST OF ASIA PACIFIC: TITANIUM DIOXIDE MARKET, BY APPLICATION, 2022–2029 (USD MILLION)
  • TABLE 78 REST OF ASIA PACIFIC: TITANIUM DIOXIDE MARKET, BY APPLICATION, 2022–2029 (KILOTON)
  • TABLE 79 NORTH AMERICA: TITANIUM DIOXIDE MARKET, BY COUNTRY, 2022–2029 (USD MILLION)
  • TABLE 80 NORTH AMERICA: TITANIUM DIOXIDE MARKET, BY COUNTRY, 2022–2029 (KILOTON)
  • TABLE 81 NORTH AMERICA: TITANIUM DIOXIDE MARKET, BY GRADE, 2018–2021 (USD MILLION)
  • TABLE 82 NORTH AMERICA: TITANIUM DIOXIDE MARKET, BY GRADE, 2022–2029 (USD MILLION)
  • TABLE 83 NORTH AMERICA: TITANIUM DIOXIDE MARKET, BY GRADE, 2018–2021 (KILOTON)
  • TABLE 84 NORTH AMERICA: TITANIUM DIOXIDE MARKET, BY GRADE, 2022–2029 (KILOTON)
  • TABLE 85 NORTH AMERICA: TITANIUM DIOXIDE MARKET, BY PROCESS, 2018–2021 (USD MILLION)
  • TABLE 86 NORTH AMERICA: TITANIUM DIOXIDE MARKET, BY PROCESS, 2022–2029 (USD MILLION)
  • TABLE 87 NORTH AMERICA: TITANIUM DIOXIDE MARKET, BY PROCESS, 2018–2021 (KILOTON)
  • TABLE 88 NORTH AMERICA: TITANIUM DIOXIDE MARKET, BY PROCESS, 2022–2029 (KILOTON)
  • TABLE 89 NORTH AMERICA: TITANIUM DIOXIDE MARKET, BY APPLICATION, 2018–2021 (USD MILLION)
  • TABLE 90 NORTH AMERICA: TITANIUM DIOXIDE MARKET, BY APPLICATION, 2022–2029 (USD MILLION)
  • TABLE 91 NORTH AMERICA: TITANIUM DIOXIDE MARKET, BY APPLICATION, 2018–2021 (KILOTON)
  • TABLE 92 NORTH AMERICA: TITANIUM DIOXIDE MARKET, BY APPLICATION, 2022–2029 (KILOTON)
  • TABLE 93 US: TITANIUM DIOXIDE MARKET, BY GRADE, 2022–2029 (USD MILLION)
  • TABLE 94 US: TITANIUM DIOXIDE MARKET, BY GRADE, 2022–2029 (KILOTON)
  • TABLE 95 US: TITANIUM DIOXIDE MARKET, BY APPLICATION, 2022–2029 (USD MILLION)
  • TABLE 96 US: TITANIUM DIOXIDE MARKET, BY APPLICATION, 2022–2029 (KILOTON)
  • TABLE 97 CANADA: TITANIUM DIOXIDE MARKET, BY GRADE, 2022–2029 (USD MILLION)
  • TABLE 98 CANADA: TITANIUM DIOXIDE MARKET, BY GRADE, 2022–2029 (KILOTON)
  • TABLE 99 CANADA: TITANIUM DIOXIDE MARKET, BY APPLICATION, 2022–2029 (USD MILLION)
  • TABLE 100 CANADA: TITANIUM DIOXIDE MARKET, BY APPLICATION, 2022–2029 (KILOTON)
  • TABLE 101 MEXICO: TITANIUM DIOXIDE MARKET, BY GRADE, 2022–2029 (USD MILLION)
  • TABLE 102 MEXICO: TITANIUM DIOXIDE MARKET, BY GRADE, 2022–2029 (KILOTON)
  • TABLE 103 MEXICO: TITANIUM DIOXIDE MARKET, BY APPLICATION, 2022–2029 (USD MILLION)
  • TABLE 104 MEXICO: TITANIUM DIOXIDE MARKET, BY APPLICATION, 2022–2029 (KILOTON)
  • TABLE 105 EUROPE: TITANIUM DIOXIDE MARKET, BY COUNTRY, 2022–2029 (USD MILLION)
  • TABLE 106 EUROPE: TITANIUM DIOXIDE MARKET, BY COUNTRY, 2022–2029 (KILOTON)
  • TABLE 107 EUROPE: TITANIUM DIOXIDE MARKET, BY GRADE, 2018–2021 (USD MILLION)
  • TABLE 108 EUROPE: TITANIUM DIOXIDE MARKET, BY GRADE, 2022–2029 (USD MILLION)
  • TABLE 109 EUROPE: TITANIUM DIOXIDE MARKET, BY GRADE, 2018–2021 (KILOTON)
  • TABLE 110 EUROPE: TITANIUM DIOXIDE MARKET, BY GRADE, 2022–2029 (KILOTON)
  • TABLE 111 EUROPE: TITANIUM DIOXIDE MARKET, BY PROCESS, 2018–2021 (USD MILLION)
  • TABLE 112 EUROPE: TITANIUM DIOXIDE MARKET, BY PROCESS, 2022–2029 (USD MILLION)
  • TABLE 113 EUROPE: TITANIUM DIOXIDE MARKET, BY PROCESS, 2018–2021 (KILOTON)
  • TABLE 114 EUROPE: TITANIUM DIOXIDE MARKET, BY PROCESS, 2022–2029 (KILOTON)
  • TABLE 115 EUROPE: TITANIUM DIOXIDE MARKET, BY APPLICATION, 2018–2021 (USD MILLION)
  • TABLE 116 EUROPE: TITANIUM DIOXIDE MARKET, BY APPLICATION, 2022–2029 (USD MILLION)
  • TABLE 117 EUROPE: TITANIUM DIOXIDE MARKET, BY APPLICATION, 2018–2021 (KILOTON)
  • TABLE 118 EUROPE: TITANIUM DIOXIDE MARKET, BY APPLICATION, 2022–2029 (KILOTON)
  • TABLE 119 GERMANY: TITANIUM DIOXIDE MARKET, BY GRADE, 2022–2029 (USD MILLION)
  • TABLE 120 GERMANY: TITANIUM DIOXIDE MARKET, BY GRADE, 2022–2029 (KILOTON)
  • TABLE 121 GERMANY: TITANIUM DIOXIDE MARKET, BY APPLICATION, 2022–2029 (USD MILLION)
  • TABLE 122 GERMANY: TITANIUM DIOXIDE MARKET, BY APPLICATION, 2022–2029 (KILOTON)
  • TABLE 123 UK: TITANIUM DIOXIDE MARKET, BY GRADE, 2022–2029 (USD MILLION)
  • TABLE 124 UK: TITANIUM DIOXIDE MARKET, BY GRADE, 2022–2029 (KILOTON)
  • TABLE 125 UK: TITANIUM DIOXIDE MARKET, BY APPLICATION, 2022–2029 (USD MILLION)
  • TABLE 126 UK: TITANIUM DIOXIDE MARKET, BY APPLICATION, 2022–2029 (KILOTON)
  • TABLE 127 FRANCE: TITANIUM DIOXIDE MARKET, BY GRADE, 2022–2029 (USD MILLION)
  • TABLE 128 FRANCE: TITANIUM DIOXIDE MARKET, BY GRADE, 2022–2029 (KILOTON)
  • TABLE 129 FRANCE: TITANIUM DIOXIDE MARKET, BY APPLICATION, 2022–2029 (USD MILLION)
  • TABLE 130 FRANCE: TITANIUM DIOXIDE MARKET, BY APPLICATION, 2022–2029 (KILOTON)
  • TABLE 131 RUSSIA: TITANIUM DIOXIDE MARKET, BY GRADE, 2022–2029 (USD MILLION)
  • TABLE 132 RUSSIA: TITANIUM DIOXIDE MARKET, BY GRADE, 2022–2029 (KILOTON)
  • TABLE 133 RUSSIA: TITANIUM DIOXIDE MARKET, BY APPLICATION, 2022–2029 (USD MILLION)
  • TABLE 134 RUSSIA: TITANIUM DIOXIDE MARKET, BY APPLICATION, 2022–2029 (KILOTON)
  • TABLE 135 ITALY: TITANIUM DIOXIDE MARKET, BY GRADE, 2022–2029 (USD MILLION)
  • TABLE 136 ITALY: TITANIUM DIOXIDE MARKET, BY GRADE, 2022–2029 (KILOTON)
  • TABLE 137 ITALY: TITANIUM DIOXIDE MARKET, BY APPLICATION, 2022–2029 (USD MILLION)
  • TABLE 138 ITALY: TITANIUM DIOXIDE MARKET, BY APPLICATION, 2022–2029 (KILOTON)
  • TABLE 139 REST OF EUROPE: TITANIUM DIOXIDE MARKET, BY GRADE, 2022–2029 (USD MILLION)
  • TABLE 140 REST OF EUROPE: TITANIUM DIOXIDE MARKET, BY GRADE, 2022–2029 (KILOTON)
  • TABLE 141 REST OF EUROPE: TITANIUM DIOXIDE MARKET, BY APPLICATION, 2022–2029 (USD MILLION)
  • TABLE 142 REST OF EUROPE: TITANIUM DIOXIDE MARKET, BY APPLICATION, 2022–2029 (KILOTON)
  • TABLE 143 MIDDLE EAST & AFRICA: TITANIUM DIOXIDE MARKET, BY COUNTRY, 2022–2029 (USD MILLION)
  • TABLE 144 MIDDLE EAST & AFRICA: TITANIUM DIOXIDE MARKET, BY COUNTRY, 2022–2029 (KILOTON)
  • TABLE 145 MIDDLE EAST & AFRICA: TITANIUM DIOXIDE MARKET, BY GRADE, 2018–2021 (USD MILLION)
  • TABLE 146 MIDDLE EAST & AFRICA: TITANIUM DIOXIDE MARKET, BY GRADE, 2022–2029 (USD MILLION)
  • TABLE 147 MIDDLE EAST & AFRICA: TITANIUM DIOXIDE MARKET, BY GRADE, 2018–2021 (KILOTON)
  • TABLE 148 MIDDLE EAST & AFRICA: TITANIUM DIOXIDE MARKET, BY GRADE, 2022–2029 (KILOTON)
  • TABLE 149 MIDDLE EAST & AFRICA: TITANIUM DIOXIDE MARKET, BY PROCESS, 2018–2021 (USD MILLION)
  • TABLE 150 MIDDLE EAST & AFRICA: TITANIUM DIOXIDE MARKET, BY PROCESS, 2022–2029 (USD MILLION)
  • TABLE 151 MIDDLE EAST & AFRICA: TITANIUM DIOXIDE MARKET, BY PROCESS, 2018–2021 (KILOTON)
  • TABLE 152 MIDDLE EAST & AFRICA: TITANIUM DIOXIDE MARKET, BY PROCESS, 2022–2029 (KILOTON)
  • TABLE 153 MIDDLE EAST & AFRICA: TITANIUM DIOXIDE MARKET, BY APPLICATION, 2018–2021 (USD MILLION)
  • TABLE 154 MIDDLE EAST & AFRICA: TITANIUM DIOXIDE MARKET, BY APPLICATION, 2022–2029 (USD MILLION)
  • TABLE 155 MIDDLE EAST & AFRICA: TITANIUM DIOXIDE MARKET, BY APPLICATION, 2018–2021 (KILOTON)
  • TABLE 156 MIDDLE EAST & AFRICA: TITANIUM DIOXIDE MARKET, BY APPLICATION, 2022–2029 (KILOTON)
  • TABLE 157 GCC COUNTRIES: TITANIUM DIOXIDE MARKET, BY GRADE, 2022–2029 (USD MILLION)
  • TABLE 158 GCC COUNTRIES: TITANIUM DIOXIDE MARKET, BY GRADE, 2022–2029 (KILOTON)
  • TABLE 159 GCC COUNTRIES: TITANIUM DIOXIDE MARKET, BY APPLICATION, 2022–2029 (USD MILLION)
  • TABLE 160 GCC COUNTRIES: TITANIUM DIOXIDE MARKET, BY APPLICATION, 2022–2029 (KILOTON)
  • TABLE 161 SAUDI ARABIA: TITANIUM DIOXIDE MARKET, BY GRADE, 2022–2029 (USD MILLION)
  • TABLE 162 SAUDI ARABIA: TITANIUM DIOXIDE MARKET, BY GRADE, 2022–2029 (KILOTON)
  • TABLE 163 SAUDI ARABIA: TITANIUM DIOXIDE MARKET, BY APPLICATION, 2022–2029 (USD MILLION)
  • TABLE 164 SAUDI ARABIA: TITANIUM DIOXIDE MARKET, BY APPLICATION, 2022–2029 (KILOTON)
  • TABLE 165 UAE: TITANIUM DIOXIDE MARKET, BY GRADE, 2022–2029 (USD MILLION)
  • TABLE 166 UAE: TITANIUM DIOXIDE MARKET, BY GRADE, 2022–2029 (KILOTON)
  • TABLE 167 UAE: TITANIUM DIOXIDE MARKET, BY APPLICATION, 2022–2029 (USD MILLION)
  • TABLE 168 UAE: TITANIUM DIOXIDE MARKET, BY APPLICATION, 2022–2029 (KILOTON)
  • TABLE 169 REST OF GCC COUNTRIES: TITANIUM DIOXIDE MARKET, BY GRADE, 2022–2029 (USD MILLION)
  • TABLE 170 REST OF GCC COUNTRIES: TITANIUM DIOXIDE MARKET, BY GRADE, 2022–2029 (KILOTON)
  • TABLE 171 REST OF GCC COUNTRIES: TITANIUM DIOXIDE MARKET, BY APPLICATION, 2022–2029 (USD MILLION)
  • TABLE 172 REST OF GCC COUNTRIES: TITANIUM DIOXIDE MARKET, BY APPLICATION, 2022–2029 (KILOTON)
  • TABLE 173 SOUTH AFRICA: TITANIUM DIOXIDE MARKET, BY GRADE, 2022–2029 (USD MILLION)
  • TABLE 174 SOUTH AFRICA: TITANIUM DIOXIDE MARKET, BY GRADE, 2022–2029 (KILOTON)
  • TABLE 175 SOUTH AFRICA: TITANIUM DIOXIDE MARKET, BY APPLICATION, 2022–2029 (USD MILLION)
  • TABLE 176 SOUTH AFRICA: TITANIUM DIOXIDE MARKET, BY APPLICATION, 2022–2029 (KILOTON)
  • TABLE 177 REST OF MIDDLE EAST & AFRICA: TITANIUM DIOXIDE MARKET, BY GRADE, 2022–2029 (USD MILLION)
  • TABLE 178 REST OF MIDDLE EAST & AFRICA: TITANIUM DIOXIDE MARKET, BY GRADE, 2022–2029 (KILOTON)
  • TABLE 179 REST OF MIDDLE EAST & AFRICA: TITANIUM DIOXIDE MARKET, BY APPLICATION, 2022–2029 (USD MILLION)
  • TABLE 180 REST OF MIDDLE EAST & AFRICA: TITANIUM DIOXIDE MARKET, BY APPLICATION, 2022–2029 (KILOTON)
  • TABLE 181 SOUTH AMERICA: TITANIUM DIOXIDE MARKET, BY COUNTRY, 2022–2029 (USD MILLION)
  • TABLE 182 SOUTH AMERICA: TITANIUM DIOXIDE MARKET, BY COUNTRY, 2022–2029 (KILOTON)
  • TABLE 183 SOUTH AMERICA: TITANIUM DIOXIDE MARKET, BY GRADE, 2018–2021 (USD MILLION)
  • TABLE 184 SOUTH AMERICA: TITANIUM DIOXIDE MARKET, BY GRADE, 2022–2029 (USD MILLION)
  • TABLE 185 SOUTH AMERICA: TITANIUM DIOXIDE MARKET, BY GRADE, 2018–2021 (KILOTON)
  • TABLE 186 SOUTH AMERICA: TITANIUM DIOXIDE MARKET, BY GRADE, 2022–2029 (KILOTON)
  • TABLE 187 SOUTH AMERICA: TITANIUM DIOXIDE MARKET, BY PROCESS, 2018–2021 (USD MILLION)
  • TABLE 188 SOUTH AMERICA: TITANIUM DIOXIDE MARKET, BY PROCESS, 2022–2029 (USD MILLION)
  • TABLE 189 SOUTH AMERICA: TITANIUM DIOXIDE MARKET, BY PROCESS, 2018–2021 (KILOTON)
  • TABLE 190 SOUTH AMERICA: TITANIUM DIOXIDE MARKET, BY PROCESS, 2022–2029 (KILOTON)
  • TABLE 191 SOUTH AMERICA: TITANIUM DIOXIDE MARKET, BY APPLICATION, 2018–2021 (USD MILLION)
  • TABLE 192 SOUTH AMERICA: TITANIUM DIOXIDE MARKET, BY APPLICATION, 2022–2029 (USD MILLION)
  • TABLE 193 SOUTH AMERICA: TITANIUM DIOXIDE MARKET, BY APPLICATION, 2018–2021 (KILOTON)
  • TABLE 194 SOUTH AMERICA: TITANIUM DIOXIDE MARKET, BY APPLICATION, 2022–2029 (KILOTON)
  • TABLE 195 BRAZIL: TITANIUM DIOXIDE MARKET, BY GRADE, 2022–2029 (USD MILLION)
  • TABLE 196 BRAZIL: TITANIUM DIOXIDE MARKET, BY GRADE, 2022–2029 (KILOTON)
  • TABLE 197 BRAZIL: TITANIUM DIOXIDE MARKET, BY APPLICATION, 2022–2029 (USD MILLION)
  • TABLE 198 BRAZIL: TITANIUM DIOXIDE MARKET, BY APPLICATION, 2022–2029 (KILOTON)
  • TABLE 199 ARGENTINA: TITANIUM DIOXIDE MARKET, BY GRADE, 2022–2029 (USD MILLION)
  • TABLE 200 ARGENTINA: TITANIUM DIOXIDE MARKET, BY GRADE, 2022–2029 (KILOTON)
  • TABLE 201 ARGENTINA: TITANIUM DIOXIDE MARKET, BY APPLICATION, 2022–2029 (USD MILLION)
  • TABLE 202 ARGENTINA: TITANIUM DIOXIDE MARKET, BY APPLICATION, 2022–2029 (KILOTON)
  • TABLE 203 REST OF SOUTH AMERICA: TITANIUM DIOXIDE MARKET, BY GRADE, 2022–2029 (USD MILLION)
  • TABLE 204 REST OF SOUTH AMERICA: TITANIUM DIOXIDE MARKET, BY GRADE, 2022–2029 (KILOTON)
  • TABLE 205 REST OF SOUTH AMERICA: TITANIUM DIOXIDE MARKET, BY APPLICATION, 2022–2029 (USD MILLION)
  • TABLE 206 REST OF SOUTH AMERICA: TITANIUM DIOXIDE MARKET, BY APPLICATION, 2022–2029 (KILOTON)
  • TABLE 207 OVERVIEW OF STRATEGIES DEPLOYED BY KEY PLAYERS IN TITANIUM DIOXIDE MARKET
  • TABLE 208 TITANIUM DIOXIDE MARKET: DEGREE OF COMPETITION
  • TABLE 209 TITANIUM DIOXIDE MARKET: GRADE FOOTPRINT
  • TABLE 210 TITANIUM DIOXIDE MARKET: PROCESS FOOTPRINT
  • TABLE 211 TITANIUM DIOXIDE MARKET: APPLICATION FOOTPRINT
  • TABLE 212 TITANIUM DIOXIDE MARKET: REGION FOOTPRINT
  • TABLE 213 TITANIUM DIOXIDE MARKET: DETAILED LIST OF KEY STARTUPS/SMES
  • TABLE 214 TITANIUM DIOXIDE MARKET: COMPETITIVE BENCHMARKING OF KEY STARTUPS/SMES
  • TABLE 215 TITANIUM DIOXIDE MARKET: PRODUCT LAUNCHES, APRIL 2019–JULY 2024
  • TABLE 216 TITANIUM DIOXIDE MARKET: DEALS, APRIL 2019–JULY 2024
  • TABLE 217 TITANIUM DIOXIDE MARKET: EXPANSIONS APRIL 2019–JULY 2024
  • TABLE 218 TITANIUM DIOXIDE MARKET.: OTHER DEVELOPMENTS, APRIL 2019–JULY 2024
  • TABLE 219 THE CHEMOURS COMPANY: COMPANY OVERVIEW
  • TABLE 220 THE CHEMOURS COMPANY: PRODUCTS OFFERED
  • TABLE 221 THE CHEMOURS COMPANY: PRODUCT LAUNCHES
  • TABLE 222 THE CHEMOURS COMPANY: DEALS
  • TABLE 223 THE CHEMOURS COMPANY: EXPANSIONS, APRIL 2019–DECEMBER 2024
  • TABLE 224 THE CHEMOURS COMPANY: OTHER DEVELOPMENTS, JANUARY 2019–DECEMBER 2024
  • TABLE 225 TRONOX HOLDINGS PLC: COMPANY OVERVIEW
  • TABLE 226 TRONOX HOLDINGS PLC: PRODUCTION FACILITIES
  • TABLE 227 TRONOX HOLDINGS PLC: PRODUCTS OFFERED
  • TABLE 228 TRONOX HOLDINGS PLC: DEALS
  • TABLE 229 LB GROUP: COMPANY OVERVIEW
  • TABLE 230 LB GROUP: PRODUCTS OFFERED
  • TABLE 231 LB GROUP: PRODUCT LAUNCHES
  • TABLE 232 LB GROUP: DEALS
  • TABLE 233 LB GROUP: EXPANSIONS
  • TABLE 234 KRONOS WORLDWIDE, INC.: COMPANY OVERVIEW
  • TABLE 235 KRONOS WORLDWIDE, INC.: PRODUCTION FACILITIES
  • TABLE 236 KRONOS WORLDWIDE, INC.: PRODUCTS OFFERED
  • TABLE 237 KRONOS WORLDWIDE INC.: PRODUCT LAUNCHES
  • TABLE 238 KRONOS WORLDWIDE, INC.: DEALS
  • TABLE 239 VENATOR MATERIALS PLC: COMPANY OVERVIEW
  • TABLE 240 VENATOR MATERIALS PLC: PRODUCTION FACILITIES
  • TABLE 241 VENATOR MATERIALS PLC: PRODUCTS OFFERED
  • TABLE 242 VENATOR MATERIALS PLC: DEALS
  • TABLE 243 VENATOR MATERIALS PLC: OTHER DEVELOPMENTS
  • TABLE 244 INEOS GROUP LIMITED: COMPANY OVERVIEW
  • TABLE 245 INEOS GROUP LIMITED: PRODUCTS OFFERED
  • TABLE 246 INEOS GROUP LIMITED: DEALS
  • TABLE 247 CNNC HUAYUAN TITANIUM DIOXIDE CO., LTD.: COMPANY OVERVIEW
  • TABLE 248 CNNC HUAYUAN TITANIUM DIOXIDE CO., LTD.: PRODUCTS OFFERED
  • TABLE 249 CNNC HUAYUAN TITANIUM DIOXIDE CO., LTD.: DEALS
  • TABLE 250 CNNC HUAYUAN TITANIUM DIOXIDE CO., LTD.: OTHER DEVELOPMENTS
  • TABLE 251 CINKARNA CELJE D.D.: COMPANY OVERVIEW
  • TABLE 252 CINKARNA CELJE D.D.: PRODUCTS OFFERED
  • TABLE 253 CINKARNA CELJE D.D.: PRODUCT LAUNCHES
  • TABLE 254 EVONIK INDUSTRIES AG: COMPANY OVERVIEW
  • TABLE 255 EVONIK INDUSTRIES AG: PRODUCTS OFFERED
  • TABLE 256 TAYCA CORPORATION: COMPANY OVERVIEW
  • TABLE 257 TAYCA CORPORATION: PRODUCTS OFFERED
  • TABLE 258 TITANOS GROUP: COMPANY OVERVIEW
  • TABLE 259 GPRO TITANIUM INDUSTRY CO., LTD.: COMPANY OVERVIEW
  • TABLE 260 GUANGDONG HUIYUN TITANIUM CO., LTD.: COMPANY OVERVIEW
  • TABLE 261 SHANDONG JINHAI TITANIUM RESOURCES TECHNOLOGY CO., LTD.: COMPANY OVERVIEW
  • TABLE 262 KUMYANG CO., LTD: COMPANY OVERVIEW
  • TABLE 263 TRAVANCORE TITANIUM PRODUCTS LTD.: COMPANY OVERVIEW
  • TABLE 264 PRECHEZA A.S.: COMPANY OVERVIEW
  • TABLE 265 THE KISH COMPANY, INC.: COMPANY OVERVIEW
  • TABLE 266 MEGHMANI ORGANICS LTD.: COMPANY OVERVIEW
  • TABLE 267 THE KERALA MINERALS & METALS LIMITED: COMPANY OVERVIEW
  • TABLE 268 TOR MINERALS: COMPANY OVERVIEW
  • TABLE 269 KUNCAI: COMPANY OVERVIEW
  • TABLE 270 DAWN GROUP: COMPANY OVERVIEW
  • TABLE 271 QIANJIANG FANGYUAN TITANIUM INDUSTRY CO., LTD.: COMPANY OVERVIEW
  • TABLE 272 GUANGXI JINMAO TITANIUM INDUSTRY: COMPANY OVERVIEW
LIST OF FIGURES
 
  • FIGURE 1 TITANIUM DIOXIDE MARKET: RESEARCH DESIGN
  • FIGURE 2 MARKET SIZE ESTIMATION: BOTTOM-UP APPROACH
  • FIGURE 3 MARKET SIZE ESTIMATION: TOP-DOWN APPROACH
  • FIGURE 4 MARKET SIZE ESTIMATION: SUPPLY SIDE
  • FIGURE 5 TITANIUM DIOXIDE MARKET: DATA TRIANGULATION
  • FIGURE 6 RUTILE-GRADE TITANIUM DIOXIDE TO ACCOUNT FOR LARGER MARKET SHARE DURING FORECAST PERIOD
  • FIGURE 7 SULFATE PROCESS TO CAPTURE LARGER SHARE OF TITANIUM DIOXIDE MARKET DURING FORECAST PERIOD
  • FIGURE 8 PAINTS & COATINGS TO ACCOUNT FOR LARGEST MARKET SHARE DURING FORECAST PERIOD
  • FIGURE 9 ASIA PACIFIC TO BE FASTEST-GROWING MARKET FOR TITANIUM DIOXIDE DURING FORECAST PERIOD
  • FIGURE 10 PAINTS & COATINGS AND PLASTICS APPLICATIONS TO OFFER GROWTH OPPORTUNITIES TO MARKET PLAYERS
  • FIGURE 11 CHINA CAPTURED LARGEST MARKET SHARE IN ASIA PACIFIC, IN TERMS OF VOLUME, IN 2023
  • FIGURE 12 RUTILE-GRADE TITANIUM DIOXIDE TO DOMINATE OVERALL MARKET DURING 2024–2029
  • FIGURE 13 SULFATE PROCESS TO LEAD OVERALL TITANIUM DIOXIDE MARKET, IN TERMS OF VOLUME, IN 2023
  • FIGURE 14 PAINTS & COATINGS TO COMMAND TITANIUM DIOXIDE MARKET, IN TERMS OF VOLUME, THROUGH FORECAST PERIOD
  • FIGURE 15 INDIA TO WITNESS HIGHEST CAGR IN TITANIUM DIOXIDE MARKET DURING FORECAST PERIOD
  • FIGURE 16 TITANIUM DIOXIDE MARKET: DRIVERS, RESTRAINTS, OPPORTUNITIES, AND CHALLENGES
  • FIGURE 17 NEW HOUSES SOLD IN US, 2019–2023 (THOUSAND UNITS)
  • FIGURE 18 NET ANNUAL GROWTH RATE OF DISPOSABLE INCOME PER CAPITA OF HOUSEHOLD, BY COUNTRY, 2023 (%)
  • FIGURE 19 BV+PHEV SALES, 2022 VS. 2023
  • FIGURE 20 BATTERY DEMAND FOR EVS, BY REGION, 2016–2022 (GWH/YEAR)
  • FIGURE 21 REVENUE SHIFT FOR TITANIUM DIOXIDE MANUFACTURERS
  • FIGURE 22 AVERAGE SELLING PRICE TREND OF KEY PLAYERS, BY APPLICATION
  • FIGURE 23 AVERAGE SELLING PRICE TREND OF TITANIUM DIOXIDE, BY REGION (USD/KG)
  • FIGURE 24 TITANIUM DIOXIDE MARKET ECOSYSTEM
  • FIGURE 25 MANUFACTURING TITANIUM DIOXIDE USING CHLORIDE PROCESS
  • FIGURE 26 MANUFACTURING TITANIUM DIOXIDE USING SULFATE PROCESS
  • FIGURE 27 LIST OF MAJOR PATENTS RELATED TO TITANIUM DIOXIDE, 2015–2024
  • FIGURE 28 COUNTRY-WISE EXPORT: HS CODE 282300 (USD MILLION)
  • FIGURE 29 COUNTRY-WISE IMPORT: HS CODE 282300 (USD MILLION)
  • FIGURE 30 COUNTRY-WISE EXPORT: HS CODE 320611 (USD MILLION)
  • FIGURE 31 COUNTRY-WISE IMPORT: HS CODE 320611 (USD MILLION)
  • FIGURE 32 COUNTRY-WISE EXPORT: HS CODE 320619 (USD MILLION)
  • FIGURE 33 COUNTRY-WISE IMPORT: HS CODE 320619 (USD MILLION)
  • FIGURE 34 TITANIUM DIOXIDE MARKET: PORTER’S FIVE FORCES ANALYSIS
  • FIGURE 35 INFLUENCE OF STAKEHOLDERS ON BUYING PROCESS
  • FIGURE 36 KEY BUYING CRITERIA FOR TITANIUM DIOXIDE MARKET
  • FIGURE 37 INVESTOR DEALS AND FUNDING IN CONSTRUCTION SECTOR SOARED IN 2024
  • FIGURE 38 RUTILE SEGMENT TO LEAD TITANIUM DIOXIDE MARKET DURING FORECAST PERIOD
  • FIGURE 39 SULFATE SEGMENT TO LEAD TITANIUM DIOXIDE MARKET DURING FORECAST PERIOD
  • FIGURE 40 PAINTS & COATINGS SEGMENT TO LEAD TITANIUM DIOXIDE MARKET DURING FORECAST PERIOD
  • FIGURE 41 MIDDLE EAST & AFRICA TO RECORD FASTEST GROWTH DURING FORECAST PERIOD
  • FIGURE 42 ASIA PACIFIC: TITANIUM DIOXIDE MARKET SNAPSHOT
  • FIGURE 43 NORTH AMERICA: TITANIUM DIOXIDE MARKET SNAPSHOT
  • FIGURE 44 MARKET SHARE OF KEY PLAYERS IN TITANIUM DIOXIDE MARKET, 2023
  • FIGURE 45 REVENUE ANALYSIS FOR KEY COMPANIES (2019–2023)
  • FIGURE 46 COMPANY VALUATION (USD BILLION)
  • FIGURE 47 FINANCIAL MATRIX: EV/EBITDA RATIO
  • FIGURE 48 TITANIUM DIOXIDE MARKET: BRAND/PRODUCT COMPARISON
  • FIGURE 49 TITANIUM DIOXIDE MARKET: COMPANY EVALUATION MATRIX (KEY PLAYERS), 2023
  • FIGURE 50 TITANIUM DIOXIDE MARKET: COMPANY FOOTPRINT
  • FIGURE 51 TITANIUM DIOXIDE MARKET: COMPANY EVALUATION MATRIX (STARTUPS/SMES), 2023
  • FIGURE 52 THE CHEMOURS COMPANY: COMPANY SNAPSHOT
  • FIGURE 53 TRONOX HOLDINGS PLC: COMPANY SNAPSHOT
  • FIGURE 54 LB GROUP: COMPANY SNAPSHOT
  • FIGURE 55 KRONOS WORLDWIDE, INC: COMPANY SNAPSHOT
  • FIGURE 56 VENATOR MATERIALS PLC: COMPANY SNAPSHOT
  • FIGURE 57 INEOS GROUP LIMITED: COMPANY SNAPSHOT
  • FIGURE 58 CNNC HUAYUAN TITANIUM DIOXIDE CO., LTD.: COMPANY SNAPSHOT
  • FIGURE 59 CINKARNA CELJE D.D.: COMPANY SNAPSHOT
  • FIGURE 60 EVONIK INDUSTRIES AG: COMPANY SNAPSHOT
  • FIGURE 61 TAYCA CORPORATION: COMPANY SNAPSHOT


The study involved four major activities for estimating the current size of the global Titanium dioxide market. Exhaustive secondary research was carried out to collect information on the market, the peer product market, and the parent product group market. The next step was to validate these findings, assumptions, and sizes with the industry experts across the value chain of titanium dioxide through primary research. Both the top-down and bottom-up approaches were employed to estimate the overall size of the titanium dioxide market. After that, market breakdown and data triangulation procedures were used to determine the size of different segments and sub-segments of the market.

Secondary Research

The market for the companies offering titanium dioxide is arrived at by secondary data available through paid and unpaid sources, analyzing the product portfolios of the major companies in the ecosystem, and rating the companies by their performance and quality. Various secondary sources such as Business Standard, Bloomberg, IEA, World Bank, and Factiva were referred to, to identify and collect information for this study on the titanium dioxide market. The secondary sources include annual reports, press releases, companies’ investor presentations, white papers, journals, certified publications, and articles from recognized authors, directories, and databases. In the secondary research process, various secondary sources were referred to for identifying and collecting information related to the study. Secondary sources included annual reports, press releases, and investor presentations of titanium dioxide vendors, forums, certified publications, and whitepapers. The secondary research was used to obtain critical information on the industry’s value chain, the total pool of key players, market classification, and segmentation from the market and technology-oriented perspectives.

Primary Research

In the primary research process, various primary sources from both the supply and demand sides were interviewed to obtain qualitative and quantitative information for this report. The primary sources from the supply side included industry experts, such as Chief Executive Officers (CEOs), Vice Presidents (VPs), marketing directors, technology and innovation directors, and related key executives from various key companies and organizations operating in the titanium dioxide market. After the complete market engineering (calculations for market statistics, market breakdown, market size estimations, market forecasting, and data triangulation), extensive primary research was conducted to gather information and verify and validate the critical numbers arrived at. Primary research was also conducted to identify the segmentation types, industry trends, competitive landscape of titanium dioxide offered by various market players, and key market dynamics, such as drivers, restraints, opportunities, challenges, industry trends, and key player strategies. In the complete market engineering process, the top-down and bottom-up approaches were extensively used, along with several data triangulation methods, to perform the market estimation and market forecasting for the overall market segments and subsegments listed in this report. Extensive qualitative and quantitative analysis was performed on the complete market engineering process to list the key information/insights throughout the report.

Following is the breakdown of primary respondents—

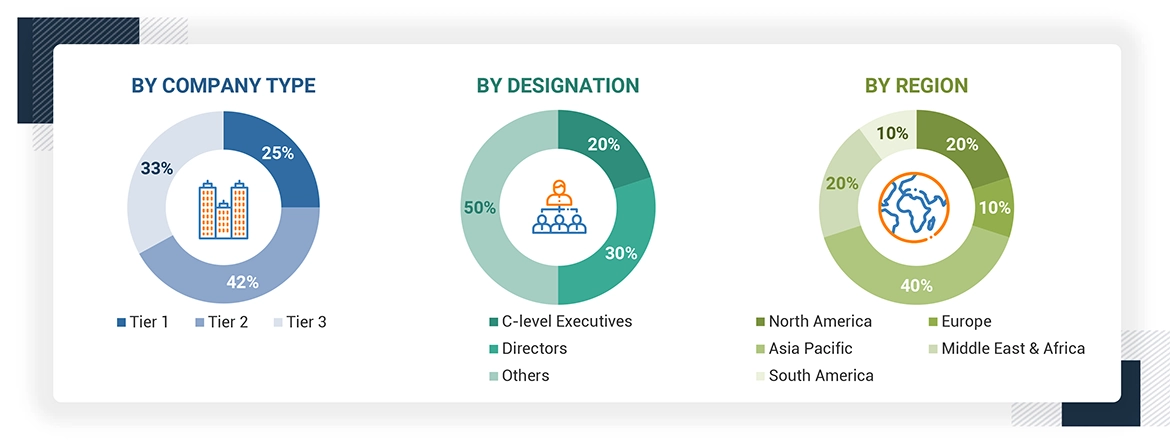
Notes: Others include sales, marketing, and product managers.

Tier 1: >USD 1 Billion; Tier 2: USD 500 million–1 Billion; and Tier 3: < USD 500 million.

To know about the assumptions considered for the study, download the pdf brochure

Market Size Estimation

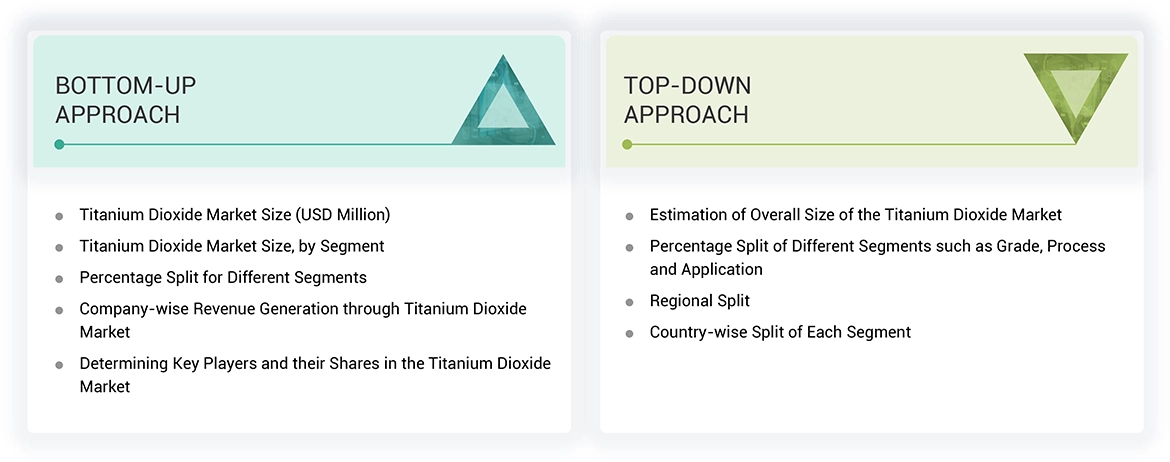
Both the top-down and bottom-up approaches were used to estimate and validate the global size of the titanium dioxide market. These approaches were also used extensively to estimate the size of various dependent segments of the market. The research methodology used to estimate the market size included the following:

Data Triangulation

After arriving at the overall market size using the market size estimation processes explained above, the market was split into several segments and subsegments. The data triangulation and market breakup procedures were employed, wherever applicable, to complete the overall market engineering process and arrive at the exact statistics of each market segment and subsegment. The data was triangulated by studying various factors and trends from both the demand and supply sides.

Market Definition

Titanium dioxide is also known as titanium (IV) oxide or Titania. It is one of the common elements naturally found in several types of rocks and mineral sands. Basically it is the ninth most abundant element found in the earth's crust. TiO2 is a white solid inorganic compound that is thermally stable, chemically inert, and non-flammable. It exhibits excellent ultraviolet (UV) resistance while acting as a UV absorbent. It is one of the whitest materials on earth, having the highest refractive index. It can be transformed into a white pigment that gives whiteness and opacity to products if ground into a fine powder. It is mainly derived from sources like mineral anatase, brookite, ilmenite, leucoxene, perovskite, rutile, and sphene. Titanium dioxide pigments are used in paints and coatings, plastics, paper, inks, and many other applications.

Stakeholders

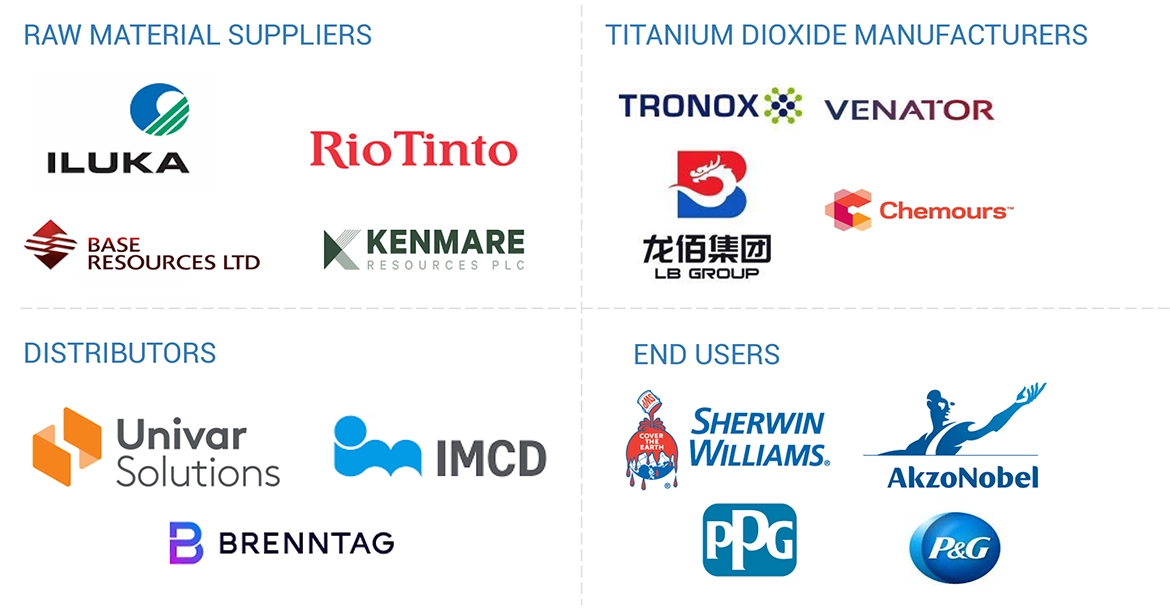
  • Titanium dioxide manufacturers
  • Titanium dioxide traders, distributors, and suppliers
  • Associations and industrial bodies
  • Research and consulting firms
  • R&D institutions
  • Environmental support agencies
  • End-use market participants of different segments of the titanium dioxide market
  • Government and research organizations
  • Investment banks and private equity firms

Report Objectives

  • To estimate and forecast the titanium dioxide  market, in terms of value and volume
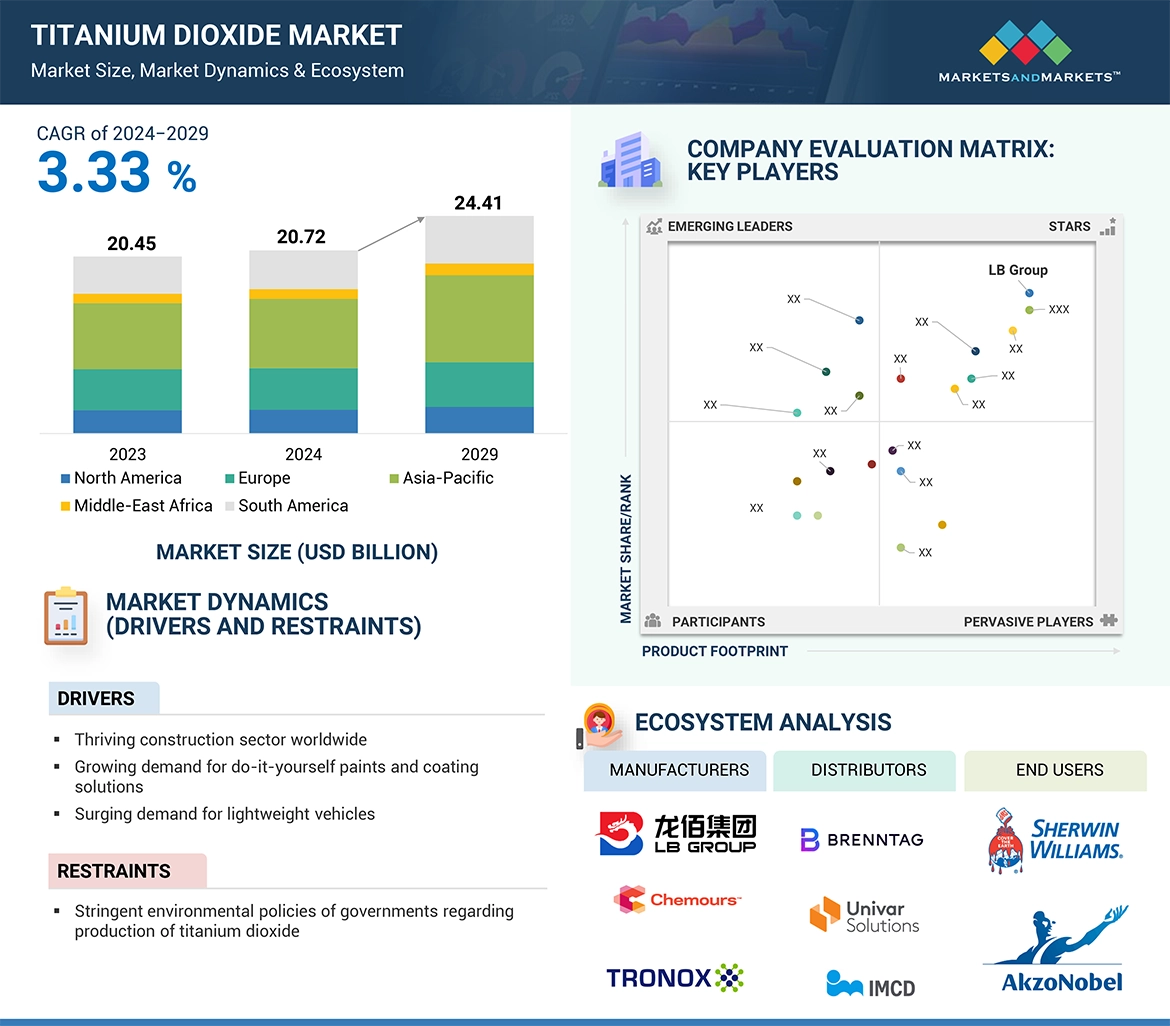
  • To provide detailed information about the major factors (drivers, restraints, opportunities, and challenges) influencing the market growth
  • To define, describe, and forecast the market size, based on process, application, grade, and region
  • To forecast the market size along with segments and submarkets, in key regions: North America, Europe, Asia Pacific (APAC), Middle East & Africa, and South America along with their key countries
  • To strategically analyze micro markets, for individual growth trends, prospects, and their contribution to the total market
  • To analyze growth opportunities in the market for stakeholders and provide details on the competitive landscape for market leaders
  • To strategically profile key players and comprehensively analyze their market shares and core competencies
  • To analyze competitive developments, such as product launches , merger & acquisition, expansion & investment, and agreements in the titanium dioxide  market


Previous Versions of this Report

Titanium Dioxide Market by Grade (Rutile, Anatase), Process (Sulfate, Chloride), Application (Paints & Coating, Plastics, Paper, Inks), & Region(North America, Europe, Asia Pacific, MEA, South America) - Trends and Forecasts up to 2026

Report Code CH 5111
Published in Jul, 2021, By MarketsandMarkets™

Titanium Dioxide Market by Grade (Rutile, Anatase), Process (Sulfate, Chloride), Application (Paints & Coating, Plastics, Paper, Inks), & Region(North America, Europe, Asia Pacific, MEA, South America) - Trends and Forecasts up to 2026

Report Code CH 5111
Published in Mar, 2017, By MarketsandMarkets™

Custom Market Research Services

We Will Customise The Research For You, In Case The Report Listed Above Does Not Meet With Your Requirements

Get 10% Free Customisation

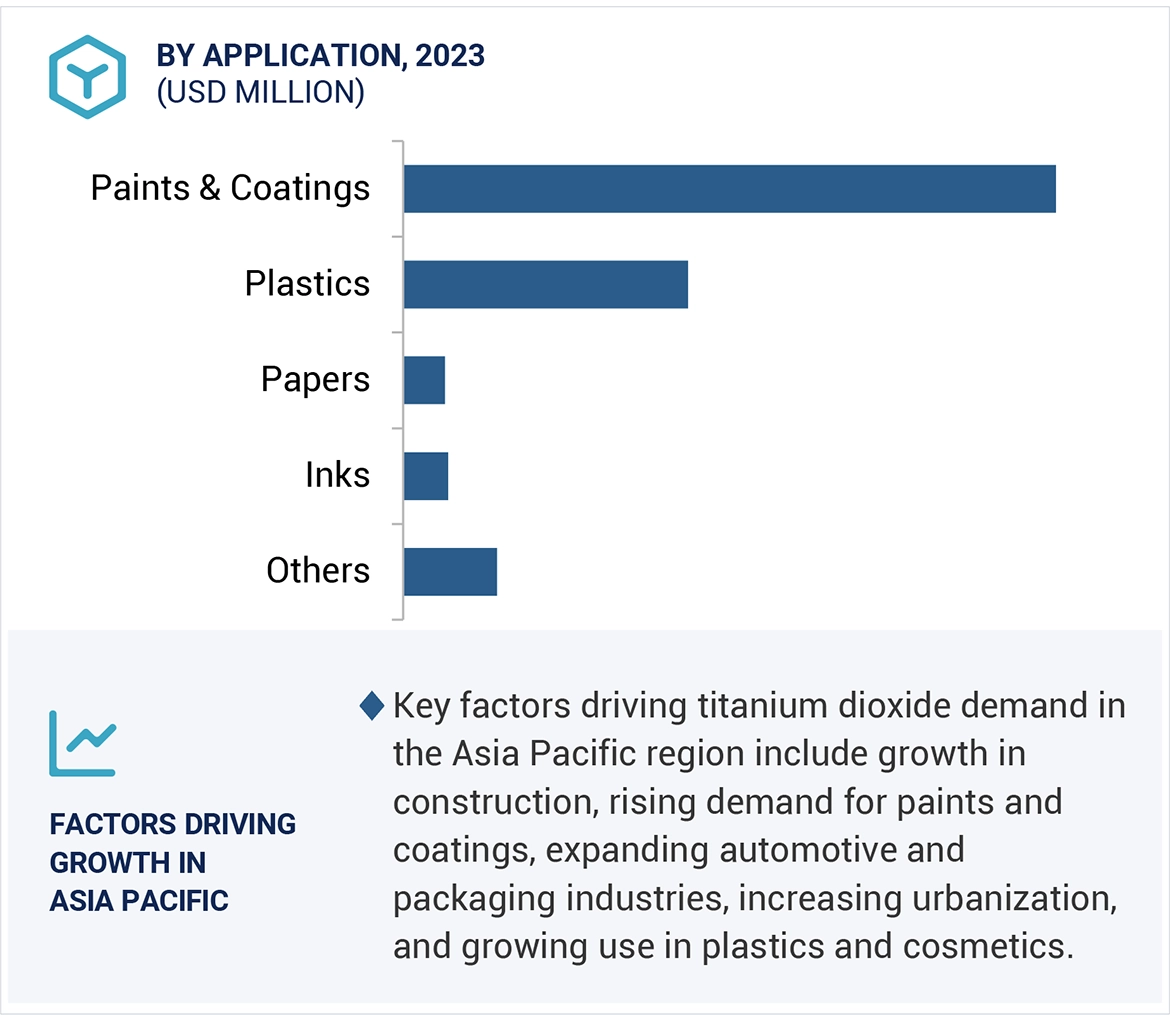
Growth opportunities and latent adjacency in Titanium Dioxide Market

DMCA.com Protection Status